Pleistocene Sea Level Maps
This website provides maps published in 2000 and 2006 that depict sea level change on the Sunda and Sahul Continental Shelves during the Pleistocene.
Copyrights on the maps presented here belong to The Field Museum of Natural History (© 2000 Field Museum of Natural History, Chicago, Illinois USA and © 2006 Field Museum of Natural History, Chicago, Illinois USA). Black and white or color versions of the maps that appear here may be downloaded for non-commercial scholarly, scientific or educational purposes. Any commercial use of the illustrations is expressly prohibited without the written permission of the first author. The maps may be downloaded, copied, modified, and re-published for non-commercial purposes as long as The Field Museum of Natural History is acknowledged and the original publication source is cited. The two publications, linked below, are as follows:
Voris, H. K. 2000. Maps of Pleistocene Sea Levels in South East Asia: Shorelines, River Systems, Time Durations. Journal of Biogeography 27:1153-1167.
Sathiamurthy, E. and Voris, H. K. 2006. Maps of Holocene Sea Level Transgression and Submerged Lakes on the Sunda Shelf. The Natural History Journal of Chulalongkorn University. Supplement 2:1-43.
The following maps were published in 2000 and they estimate the areas of exposed land in the Indo-Australian region during periods of 17,000, 150,000, and 250,000 years before present (YBP). The ancient shorelines are based on present day depth contours of 10, 20, 30, 40, 50, 75, 100, and 120 m. On the maps depicting shorelines at 75, 100, and 120 m below present levels (BPL), the major Pleistocene river systems of the Sunda and Sahul shelves are depicted.
Maps Published in 2000(black & white TIFF images) Click on figure name to view and/or download map.
Figure 1(a) 120 m contour with rivers.
Figure 1(b) 100 m contour with rivers.
Figure 1(c) 75 m contour with rivers.
Figure 1(d) 50 m contour without rivers.
Figure 1(e) 40 m contour without rivers.
Figure 1(f) 30 m contour without rivers.
Figure 1(g) 20 m contour without rivers.
Figure 1(h) 10 m contour without rivers.
For the following unpublished black and white maps or colorized versions of the published maps in jpg format, please contact Harold Voris:
- Base map. 0 m contour (today) with rivers.
- Base map. 0 m contour (today) without rivers.
- 120 m contour (Figure 1(a) without rivers.
- 100 m contour (Figure 1(b) without rivers.
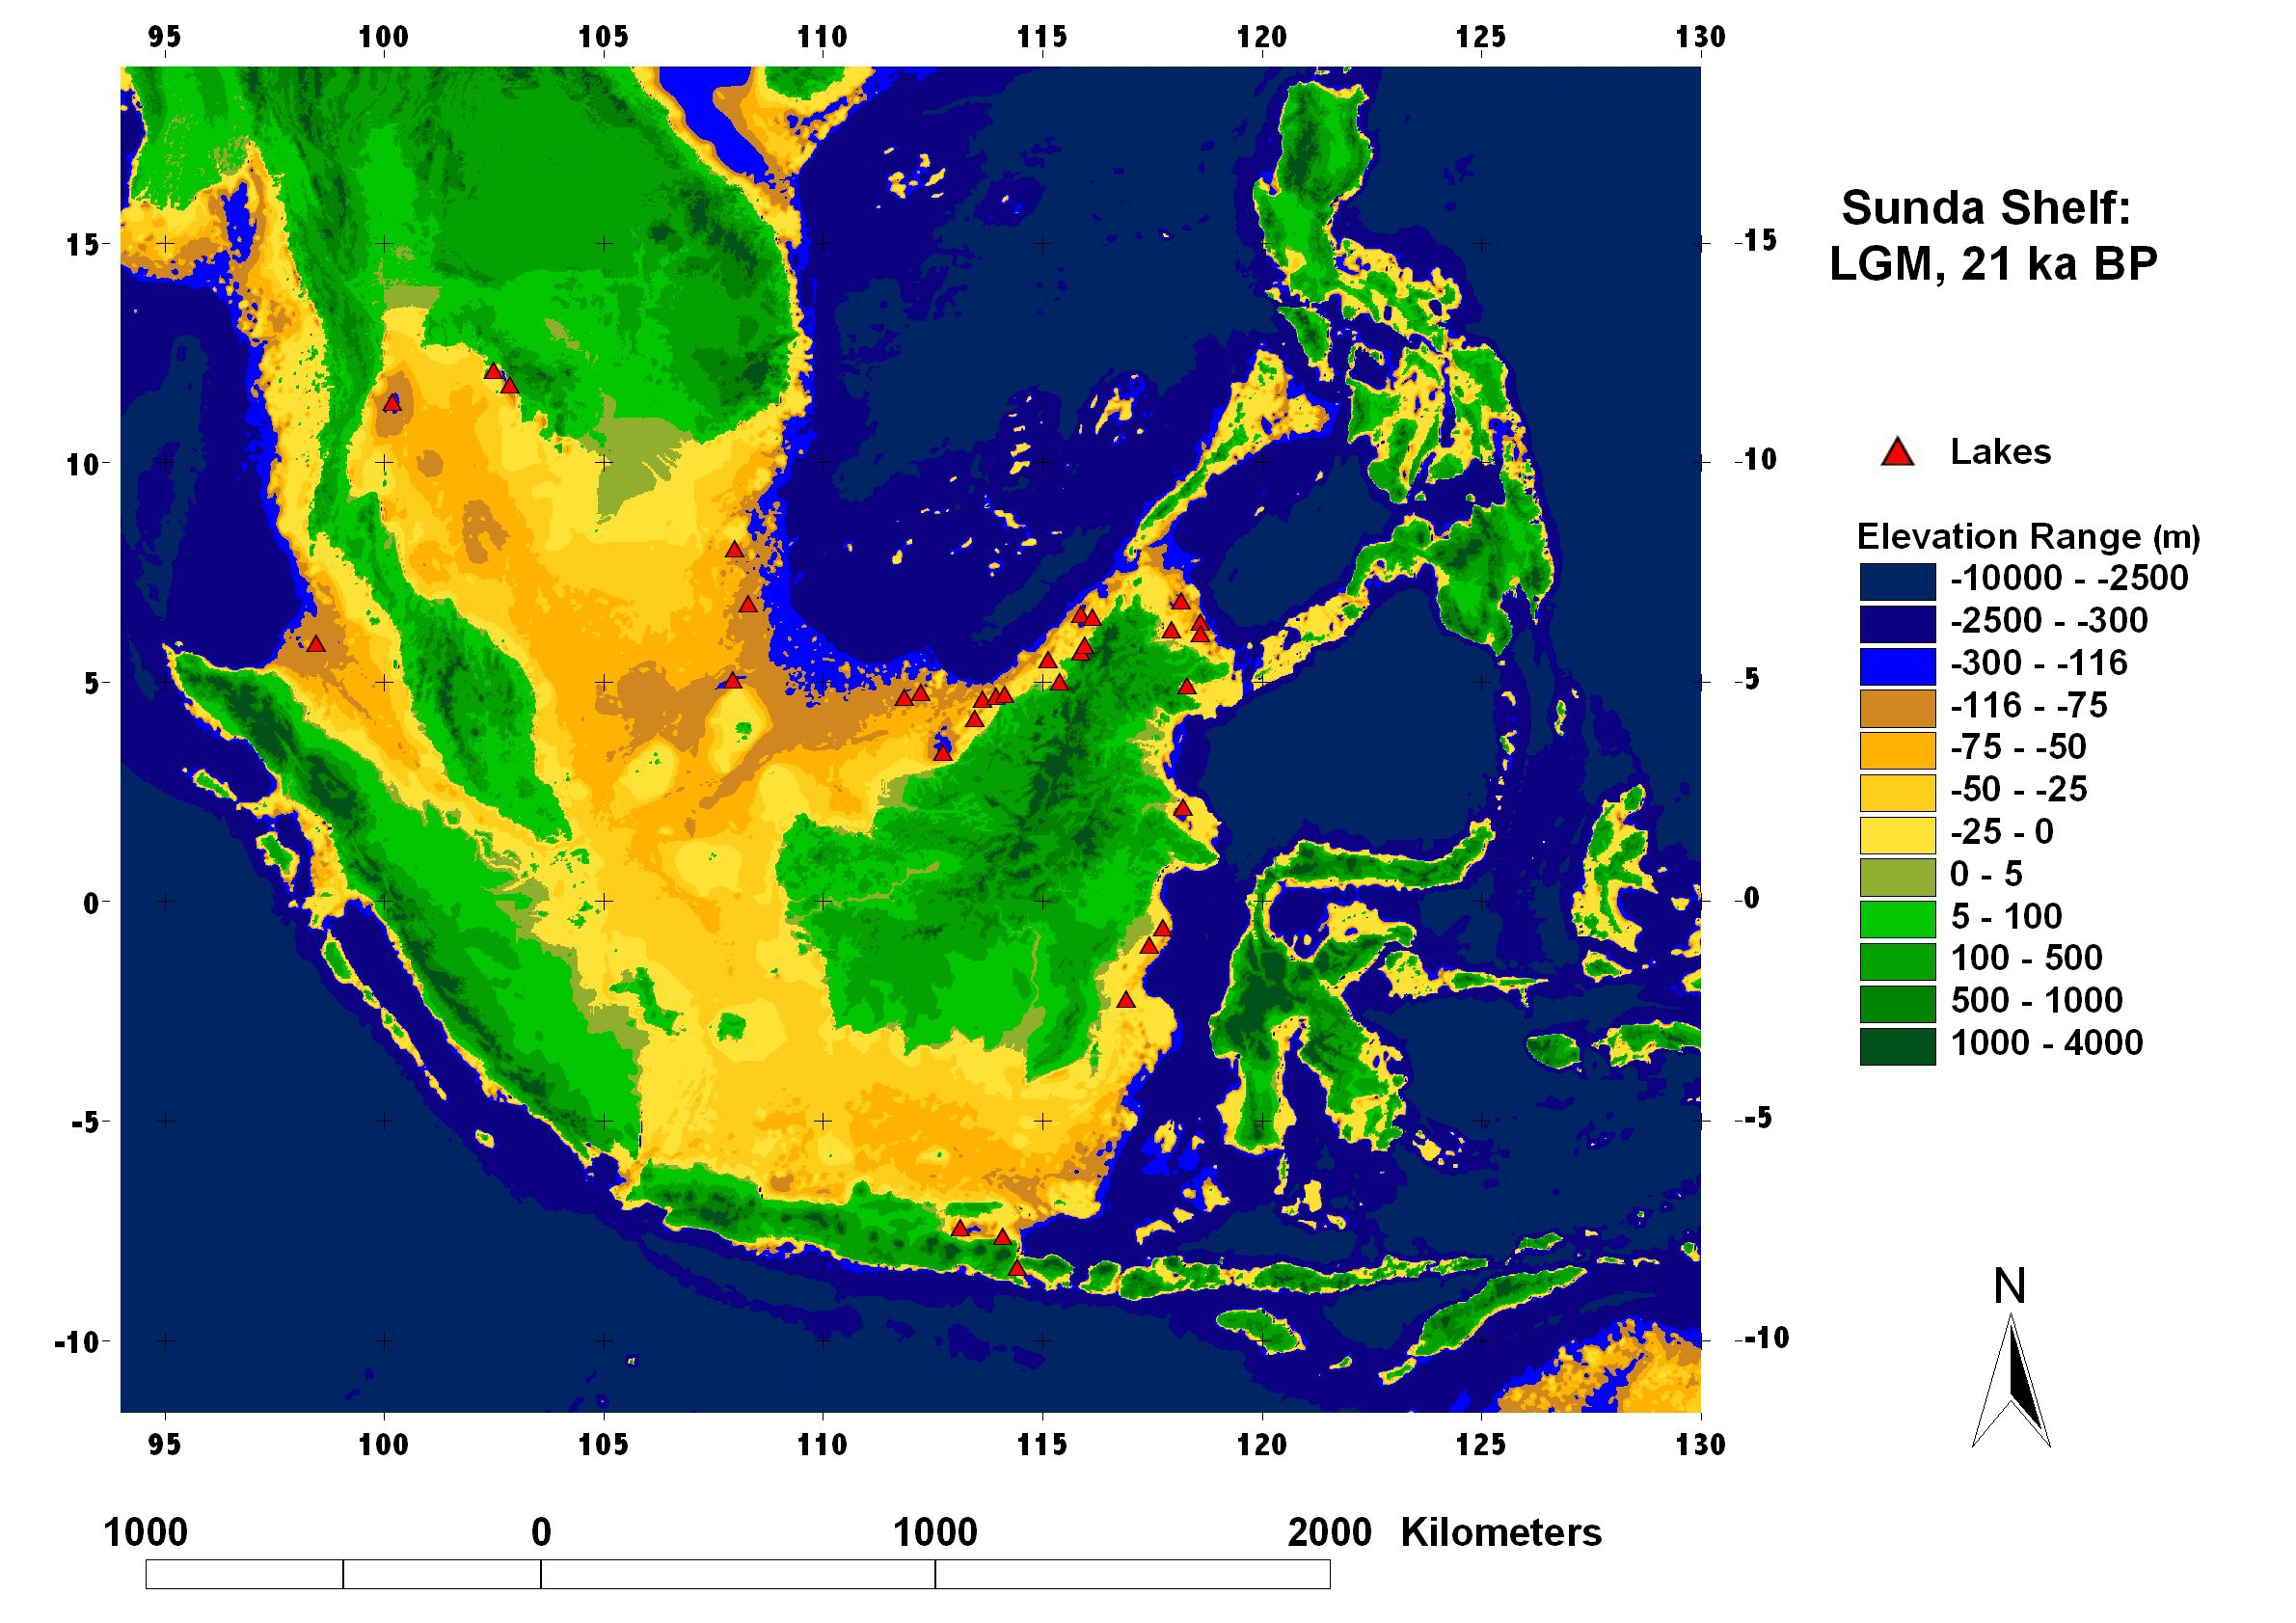
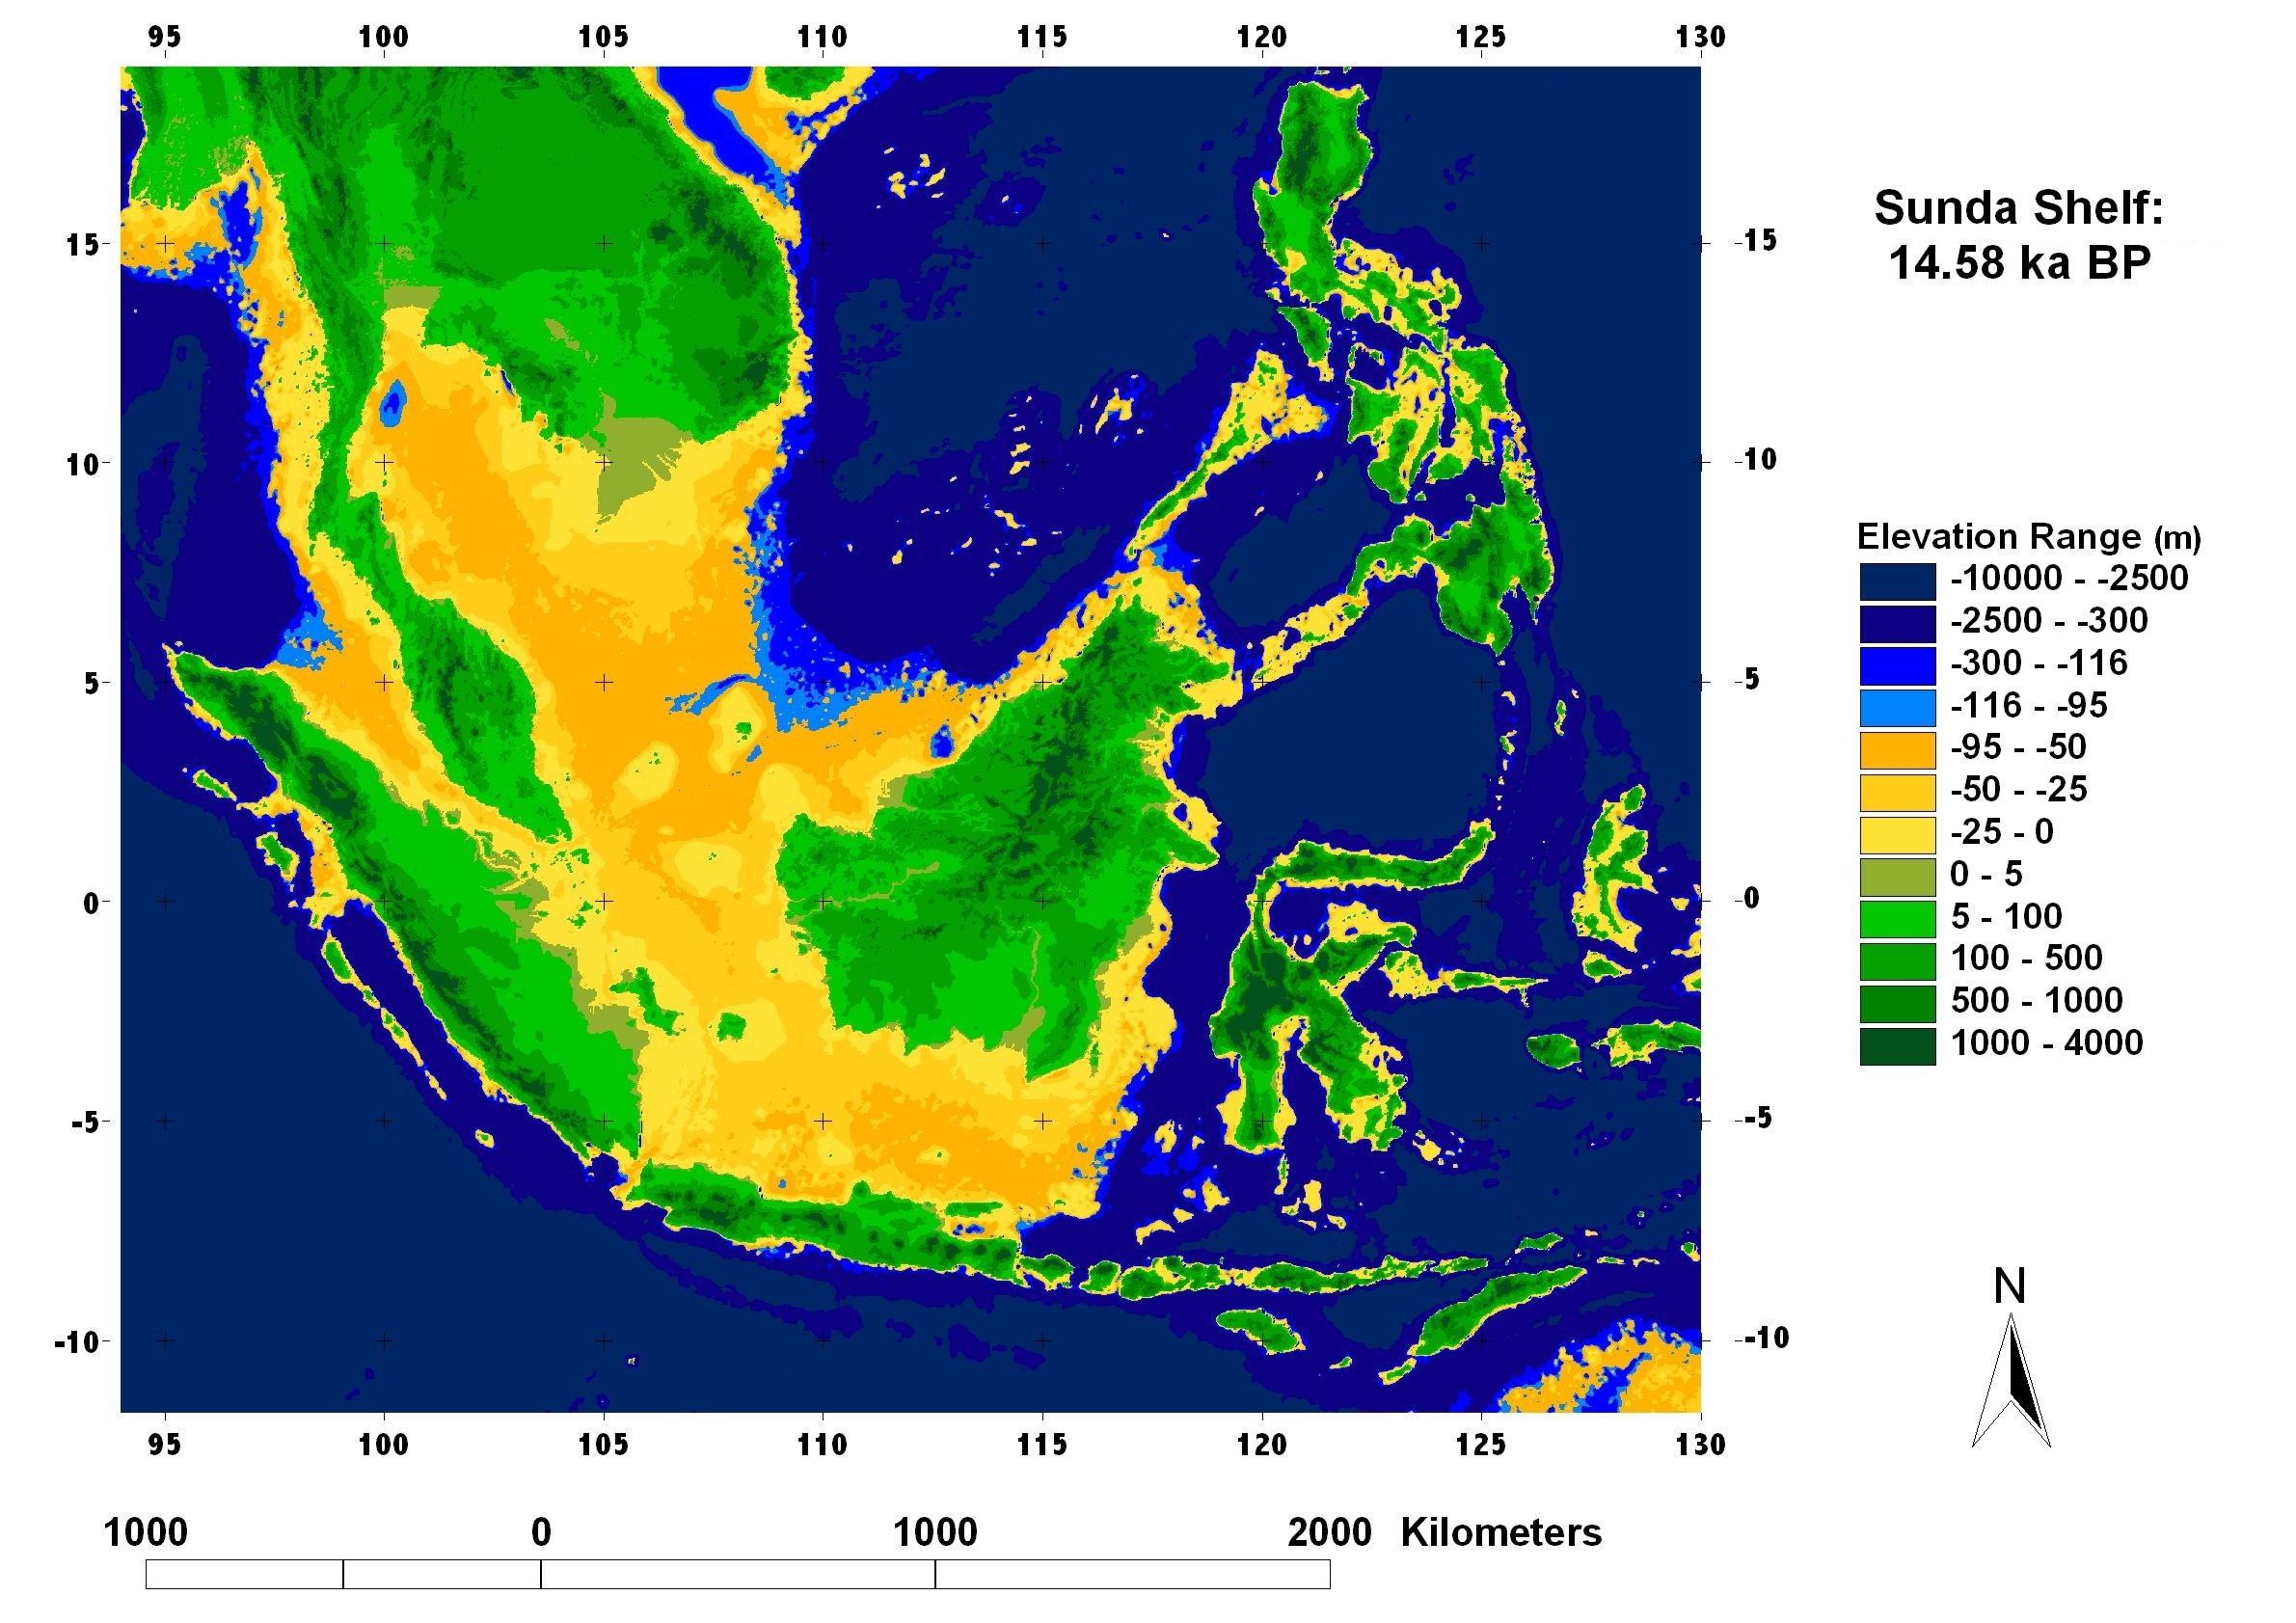
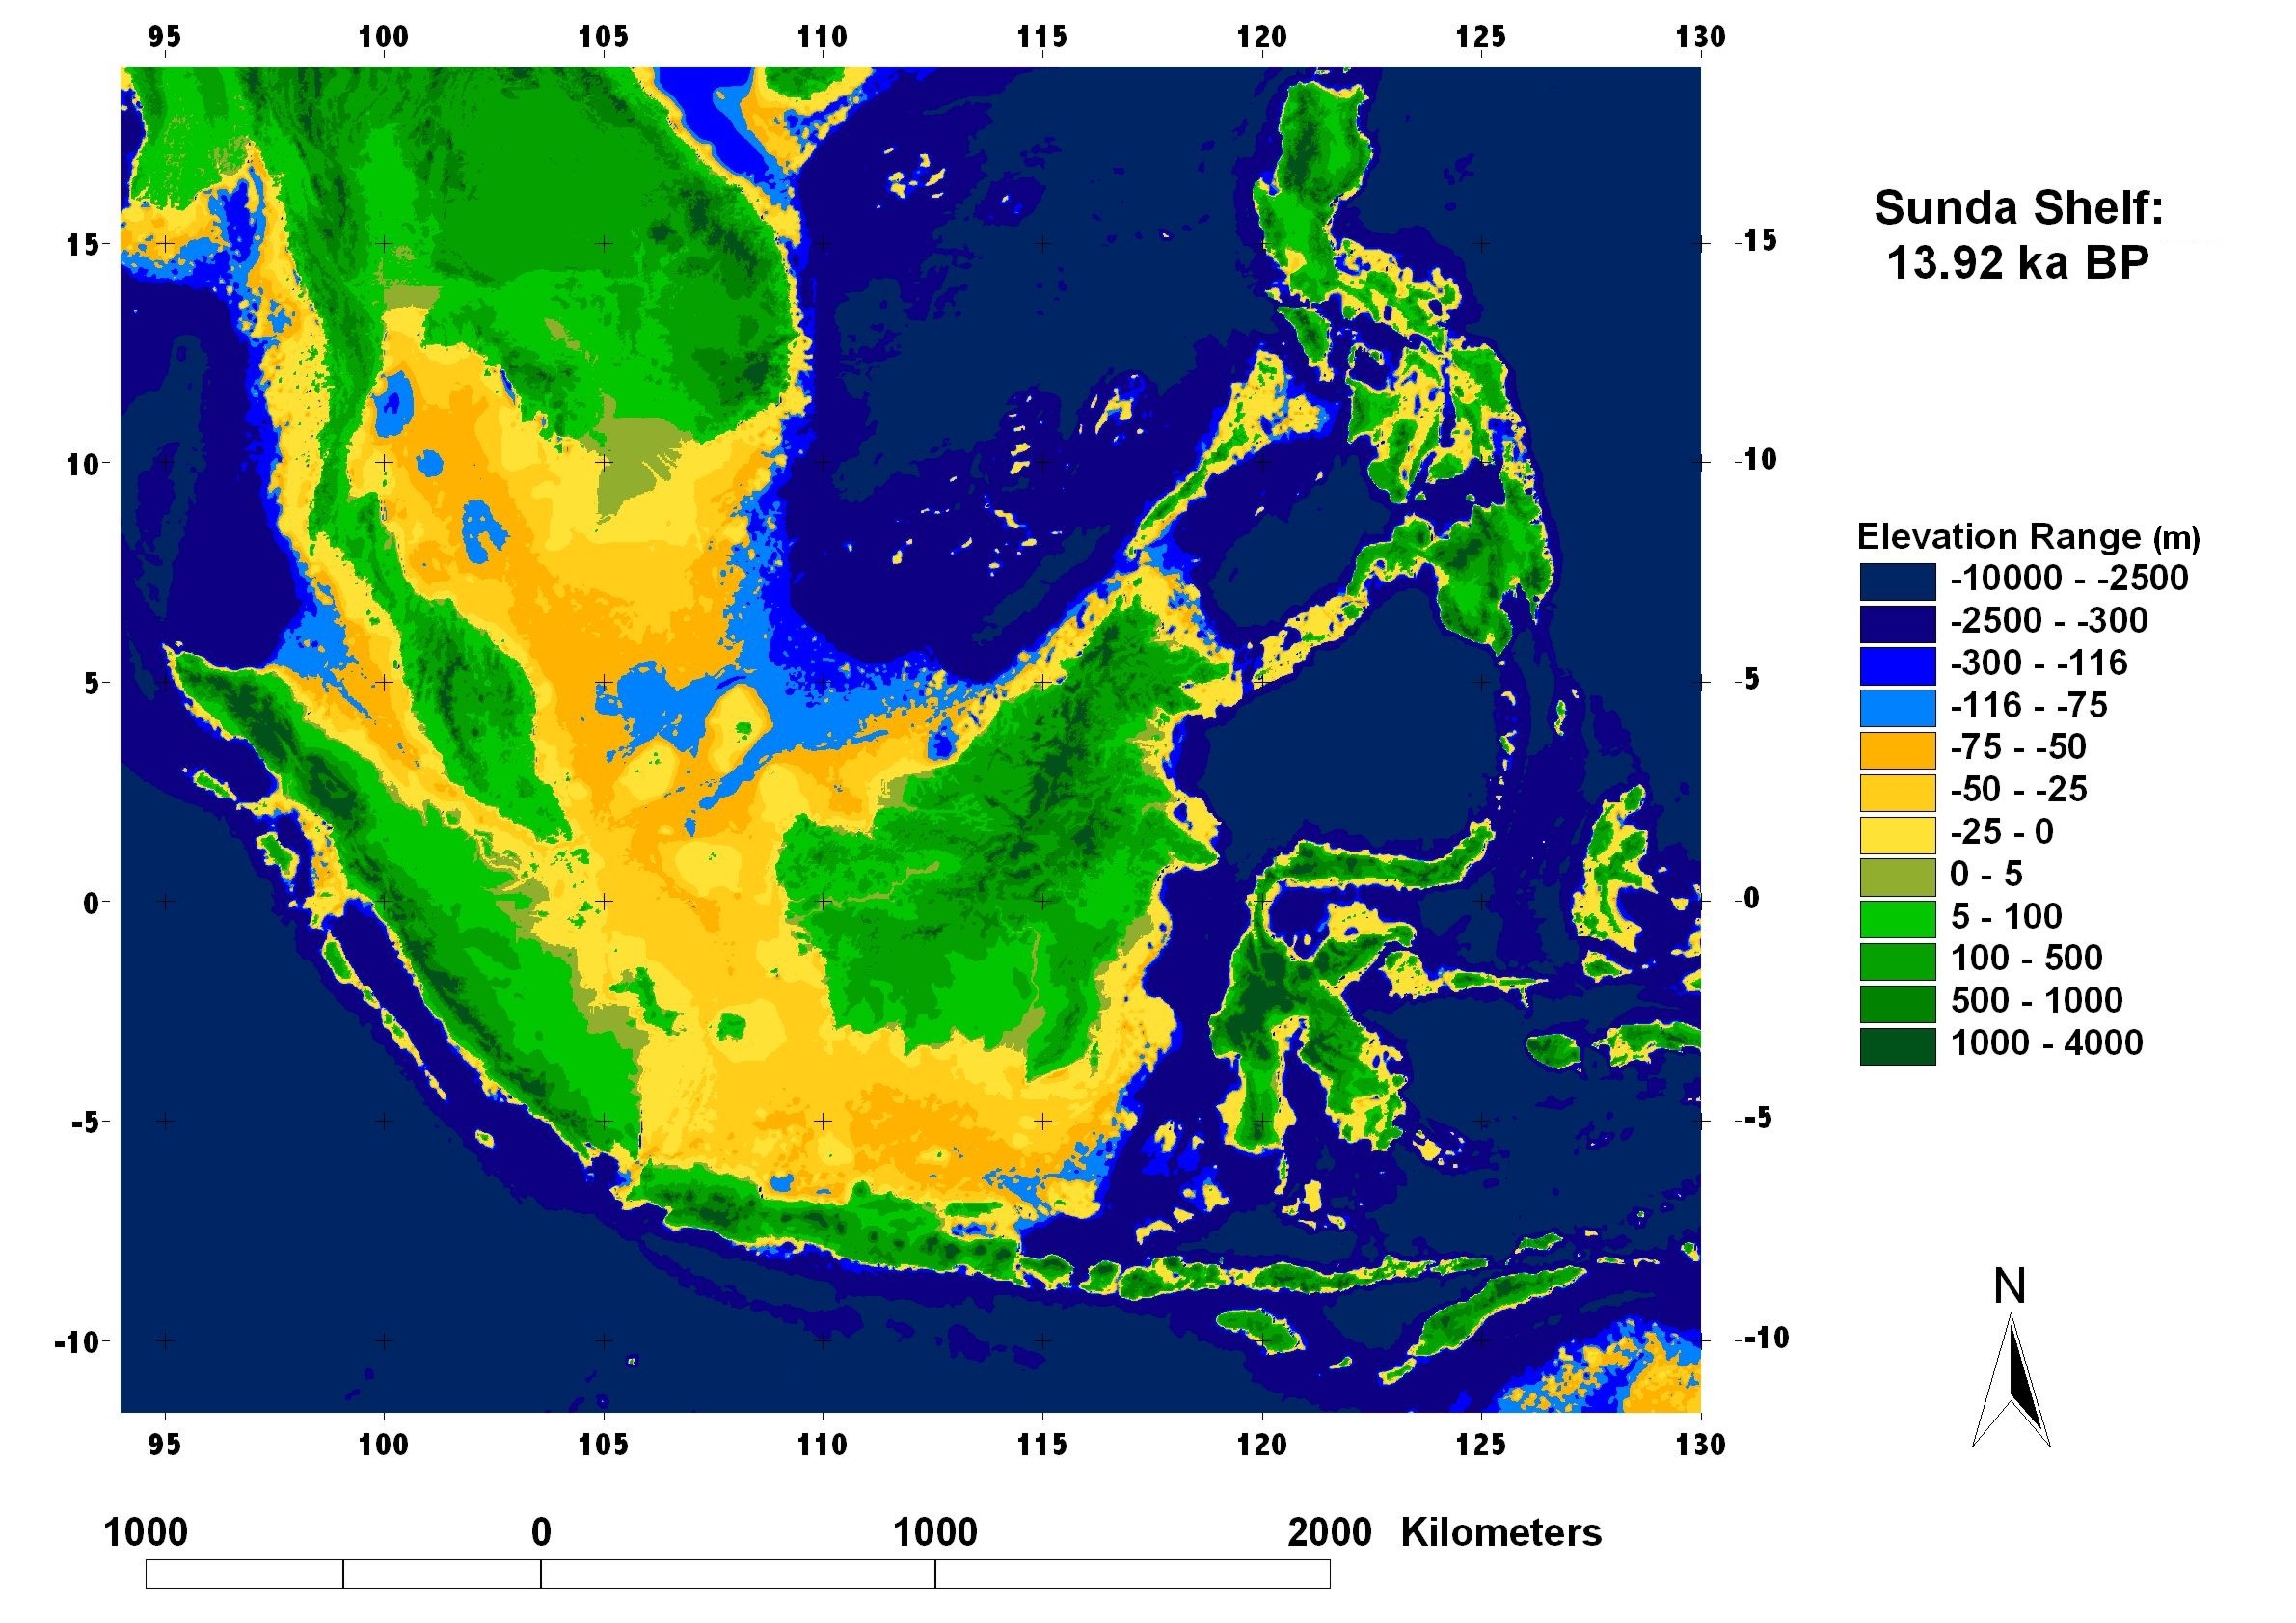
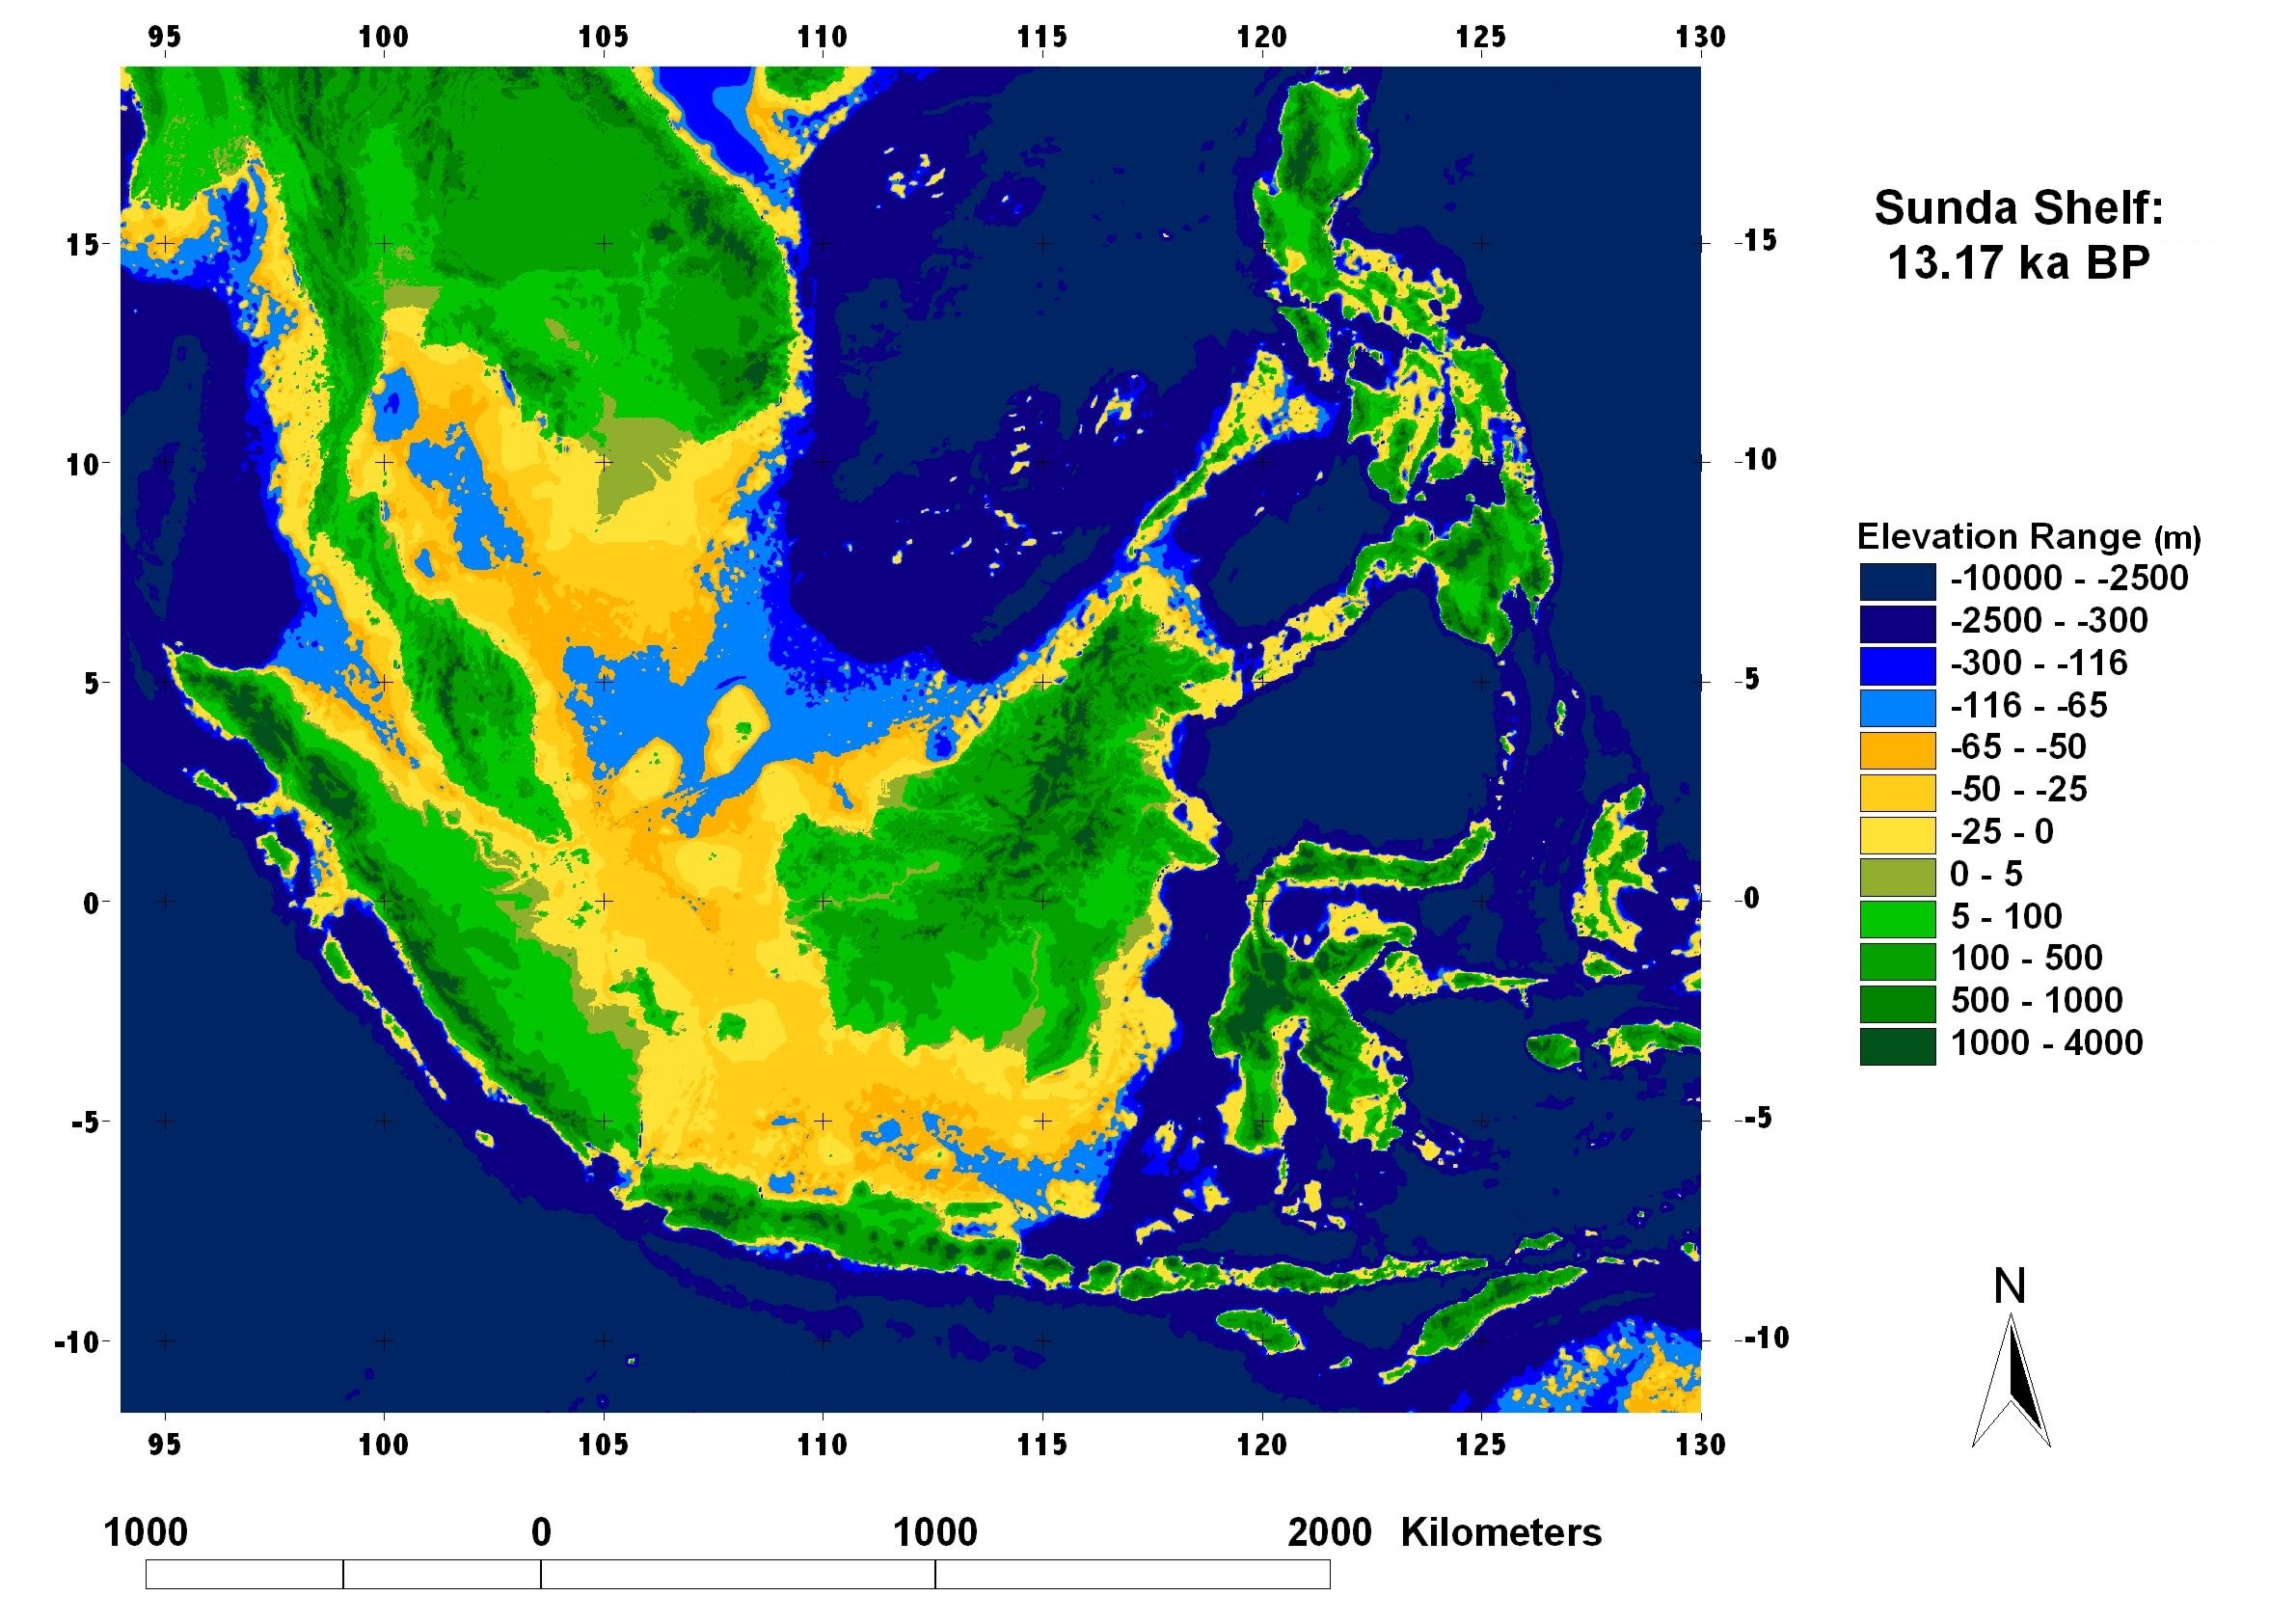
The following maps published in 2006 depict Holocene sea level transgressions on the Sunda Shelf in Southeast Asia. The present-day topography of the Sunda Shelf have been detected through spatial analysis of the Sunda Shelf using the Digital Elevation Model (DEM) developed from the ETOPO2 Global 2’ Elevation data. Please see publication (or available pdf) for further details regarding methods.
Maps Published in 2006 (full-color TIFF images) Click on figure name to view and/or download map.
Figure 2 Sunda Shelf: LGM, 21 ka BP; -116 m below present-day sea level
Figure 3 Sunda Shelf: 18.02 ka BP; -110 m below present-day sea level
Figure 4 Sunda Shelf: 16.8 ka BP; -105 m below present-day sea level
Figure 5 Sunda Shelf: 15.58 ka BP; -100 m below present-day sea level
Figure 6 Sunda Shelf: 14.58 ka BP; -95 m below present-day sea level
Figure 7 Sunda Shelf: 14.48 ka BP; -90 m below present-day sea level
Figure 8 Sunda Shelf: 14.39 ka BP; -85 m below present-day sea level
Figure 9 Sunda Shelf: 14.30 ka BP; -80 m below present-day sea level
Figure 10 Sunda Shelf: 13.92 ka BP; -75 m below present-day sea level
Figure 11 Sunda Shelf: 13.54 ka BP; -70 m below present-day sea level
Figure 12 Sunda Shelf: 13.17 ka BP; -65 m below present-day sea level
Figure 13 Sunda Shelf: 12.75 ka BP; -60 m below present-day sea level
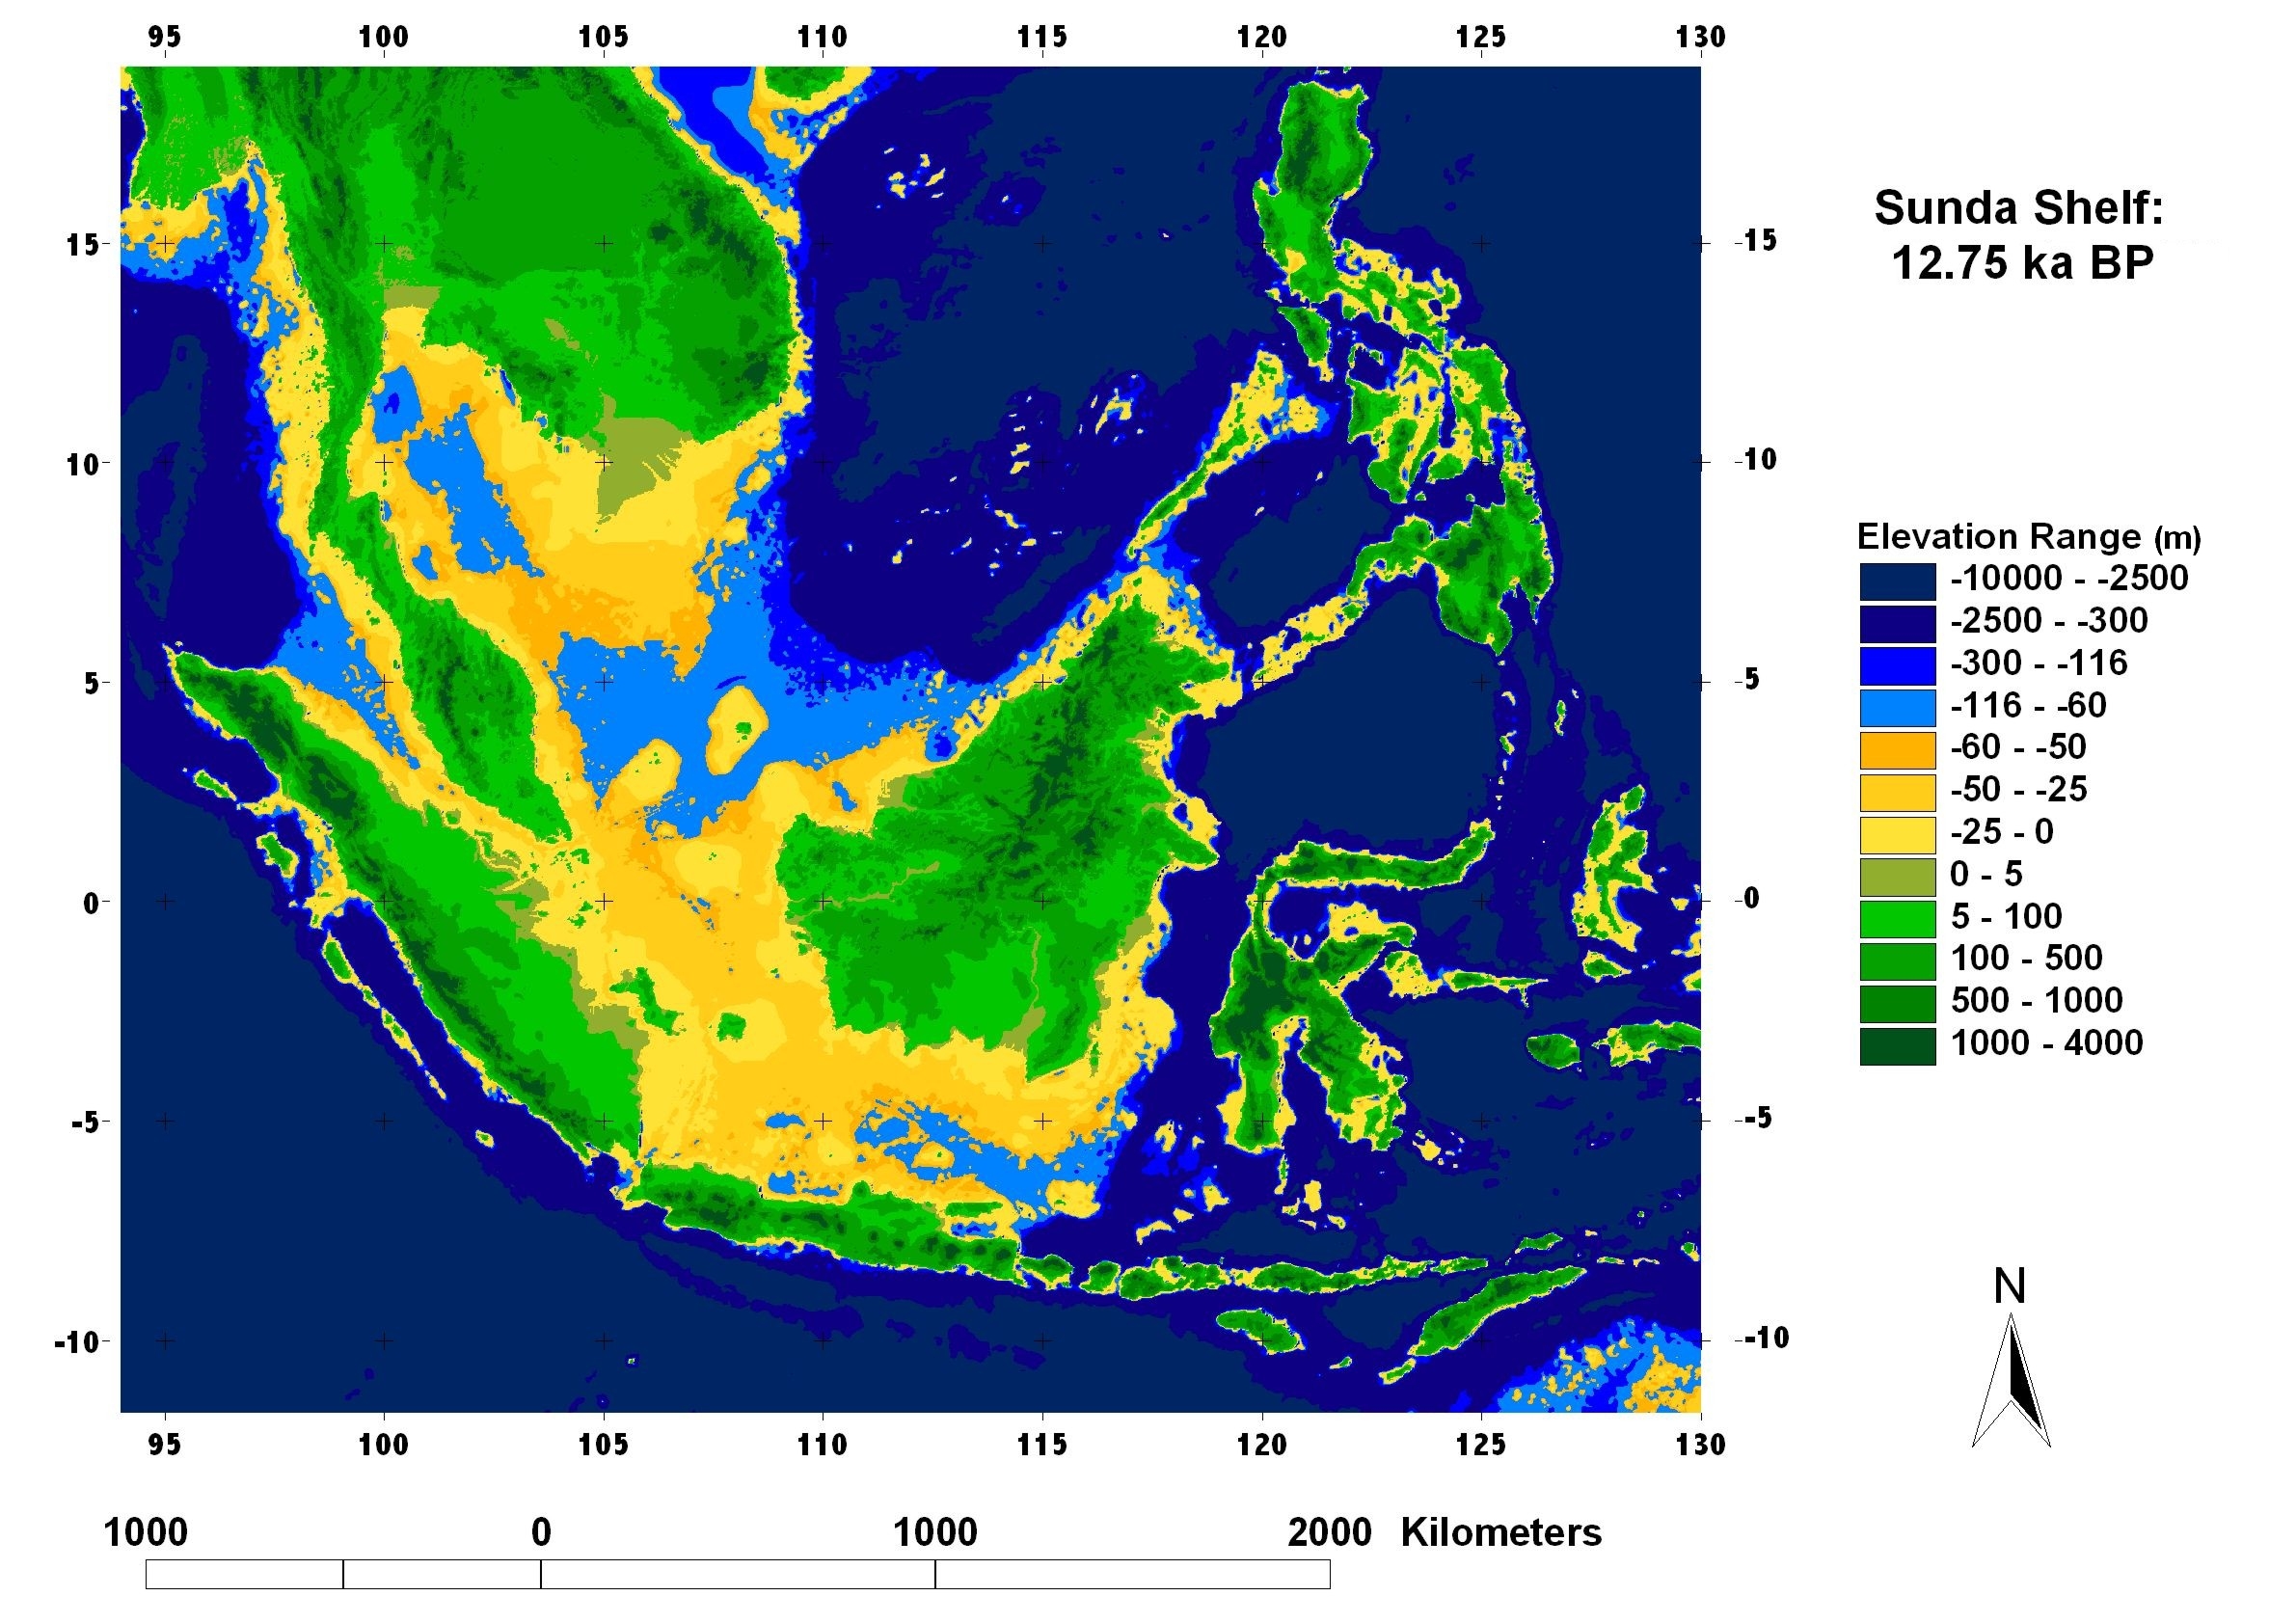
Figure 14 Sunda Shelf: 12.31 ka BP; -55 m below present-day sea level
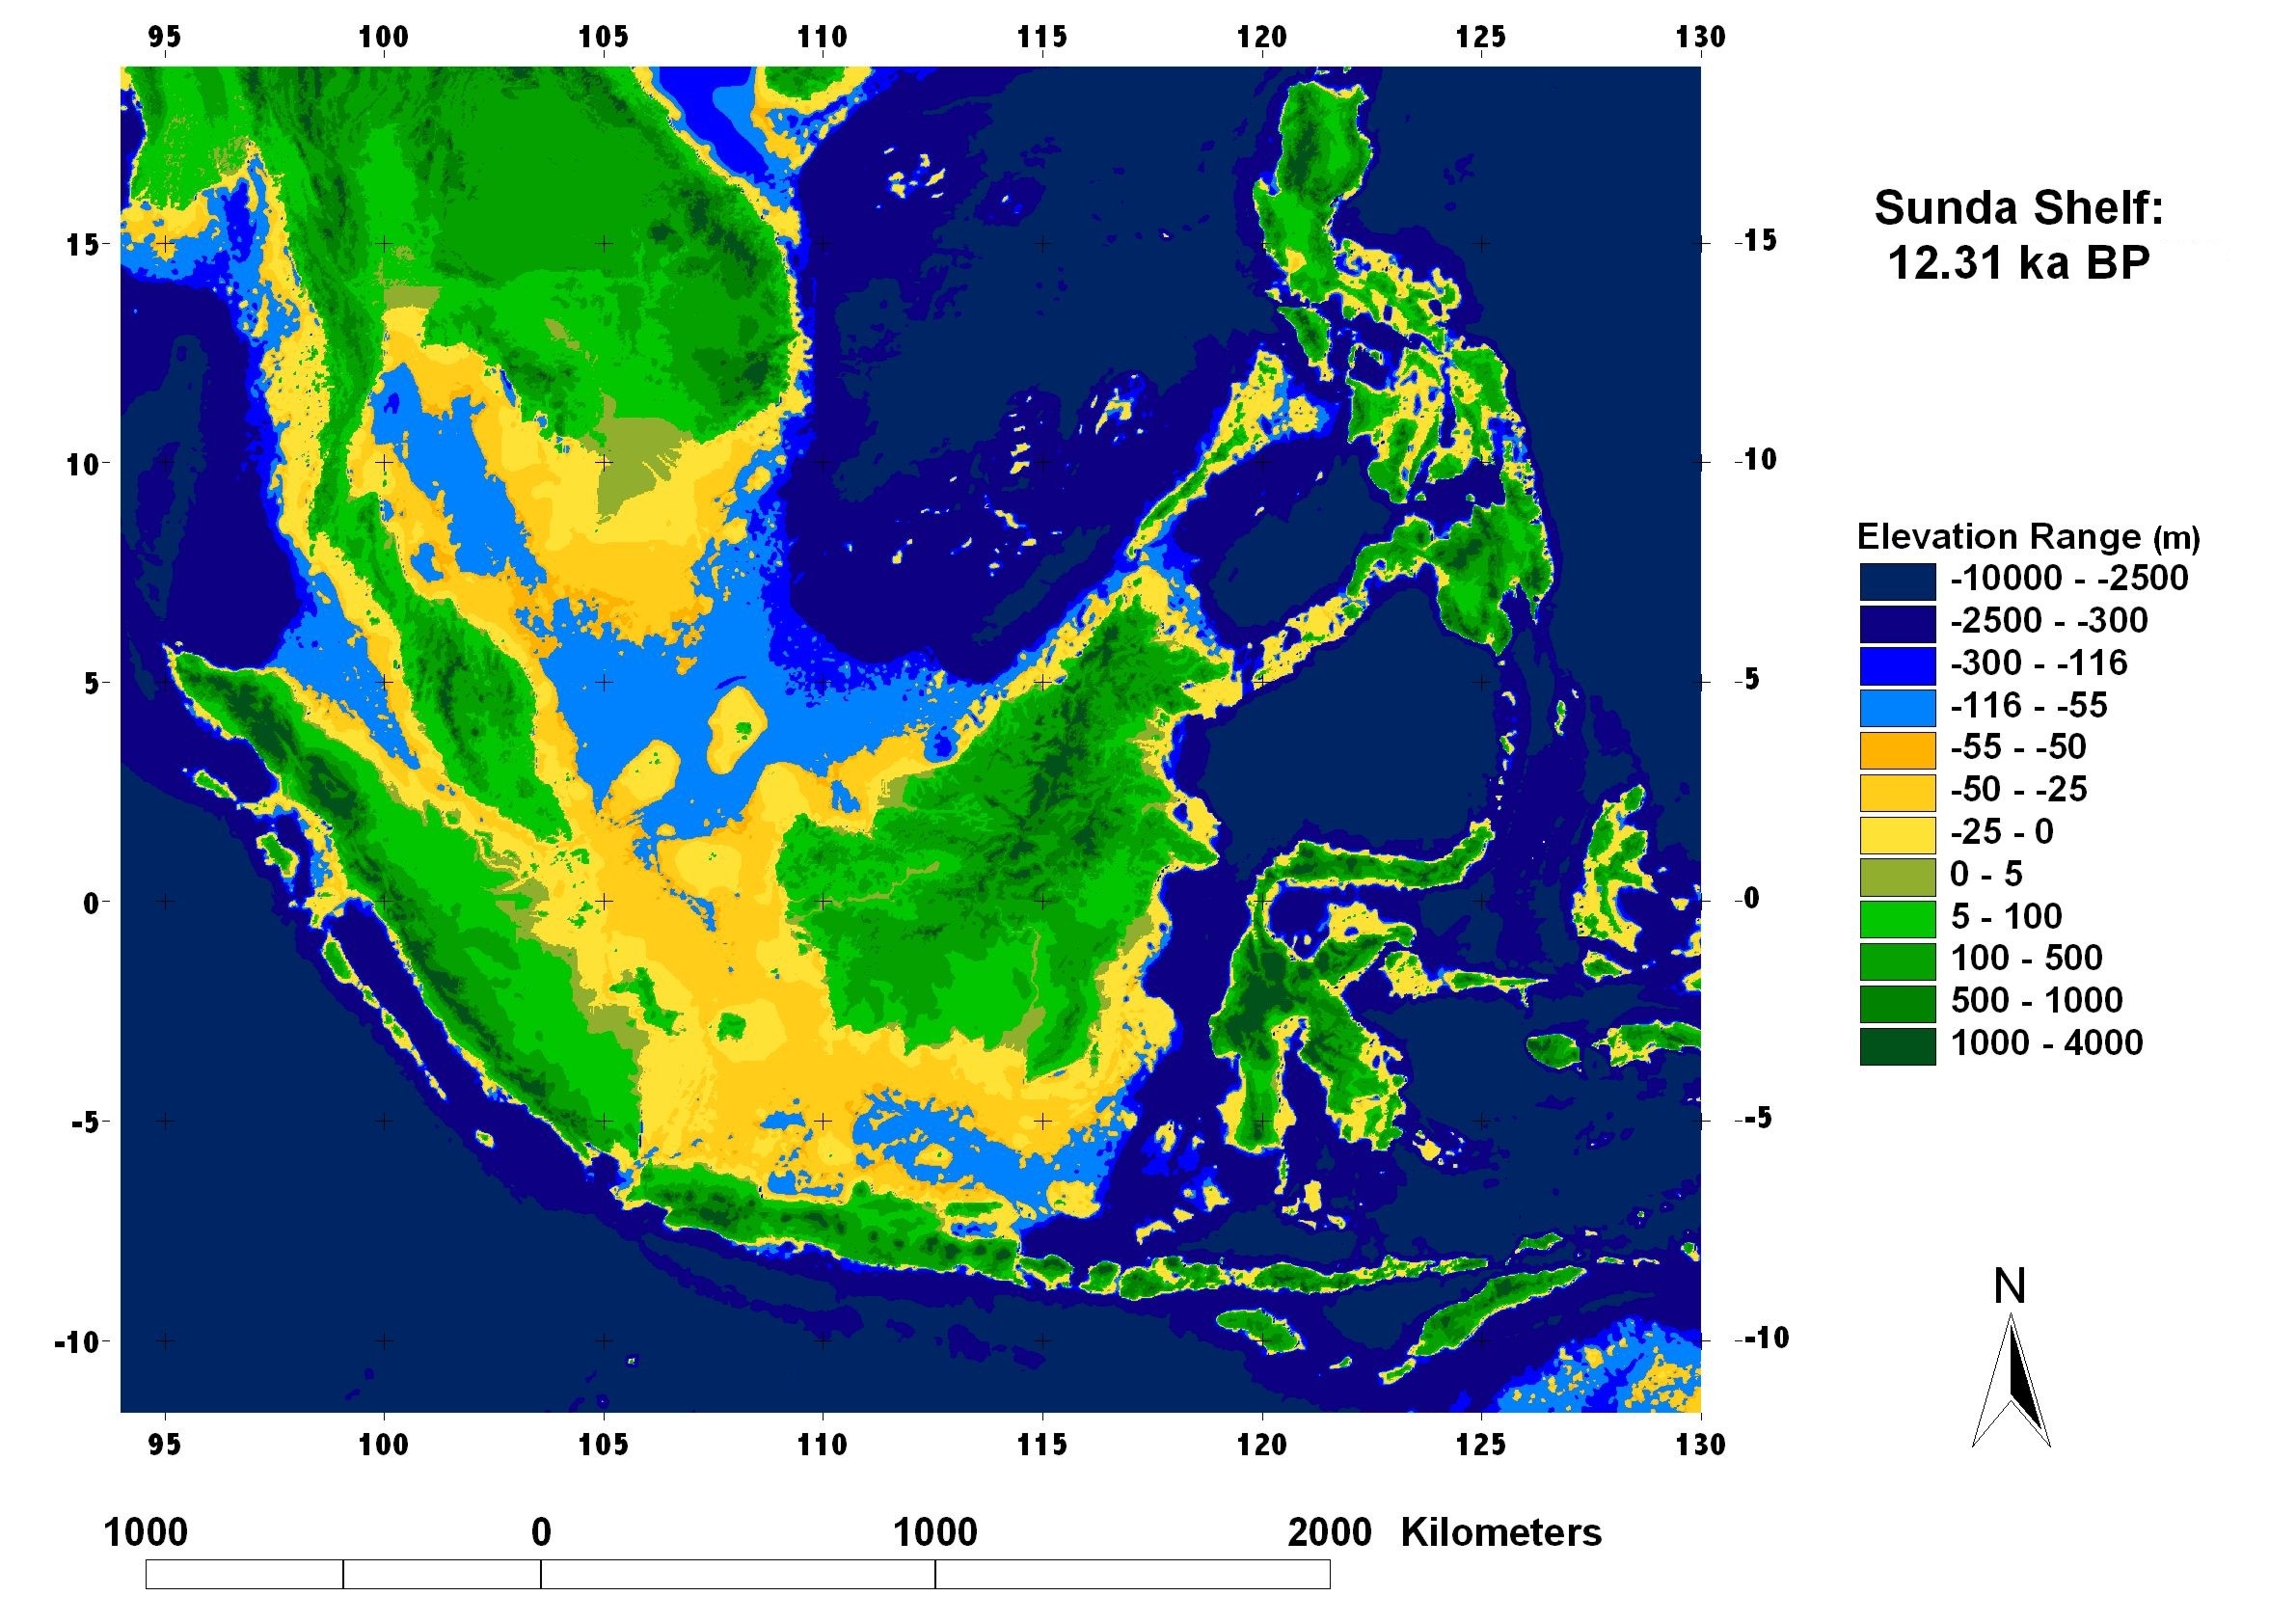
Figure 15 Sunda Shelf: 11.56 ka BP; -50 m below present-day sea level
Figure 16 Sunda Shelf: 11.23 ka BP; -45 m below present-day sea level
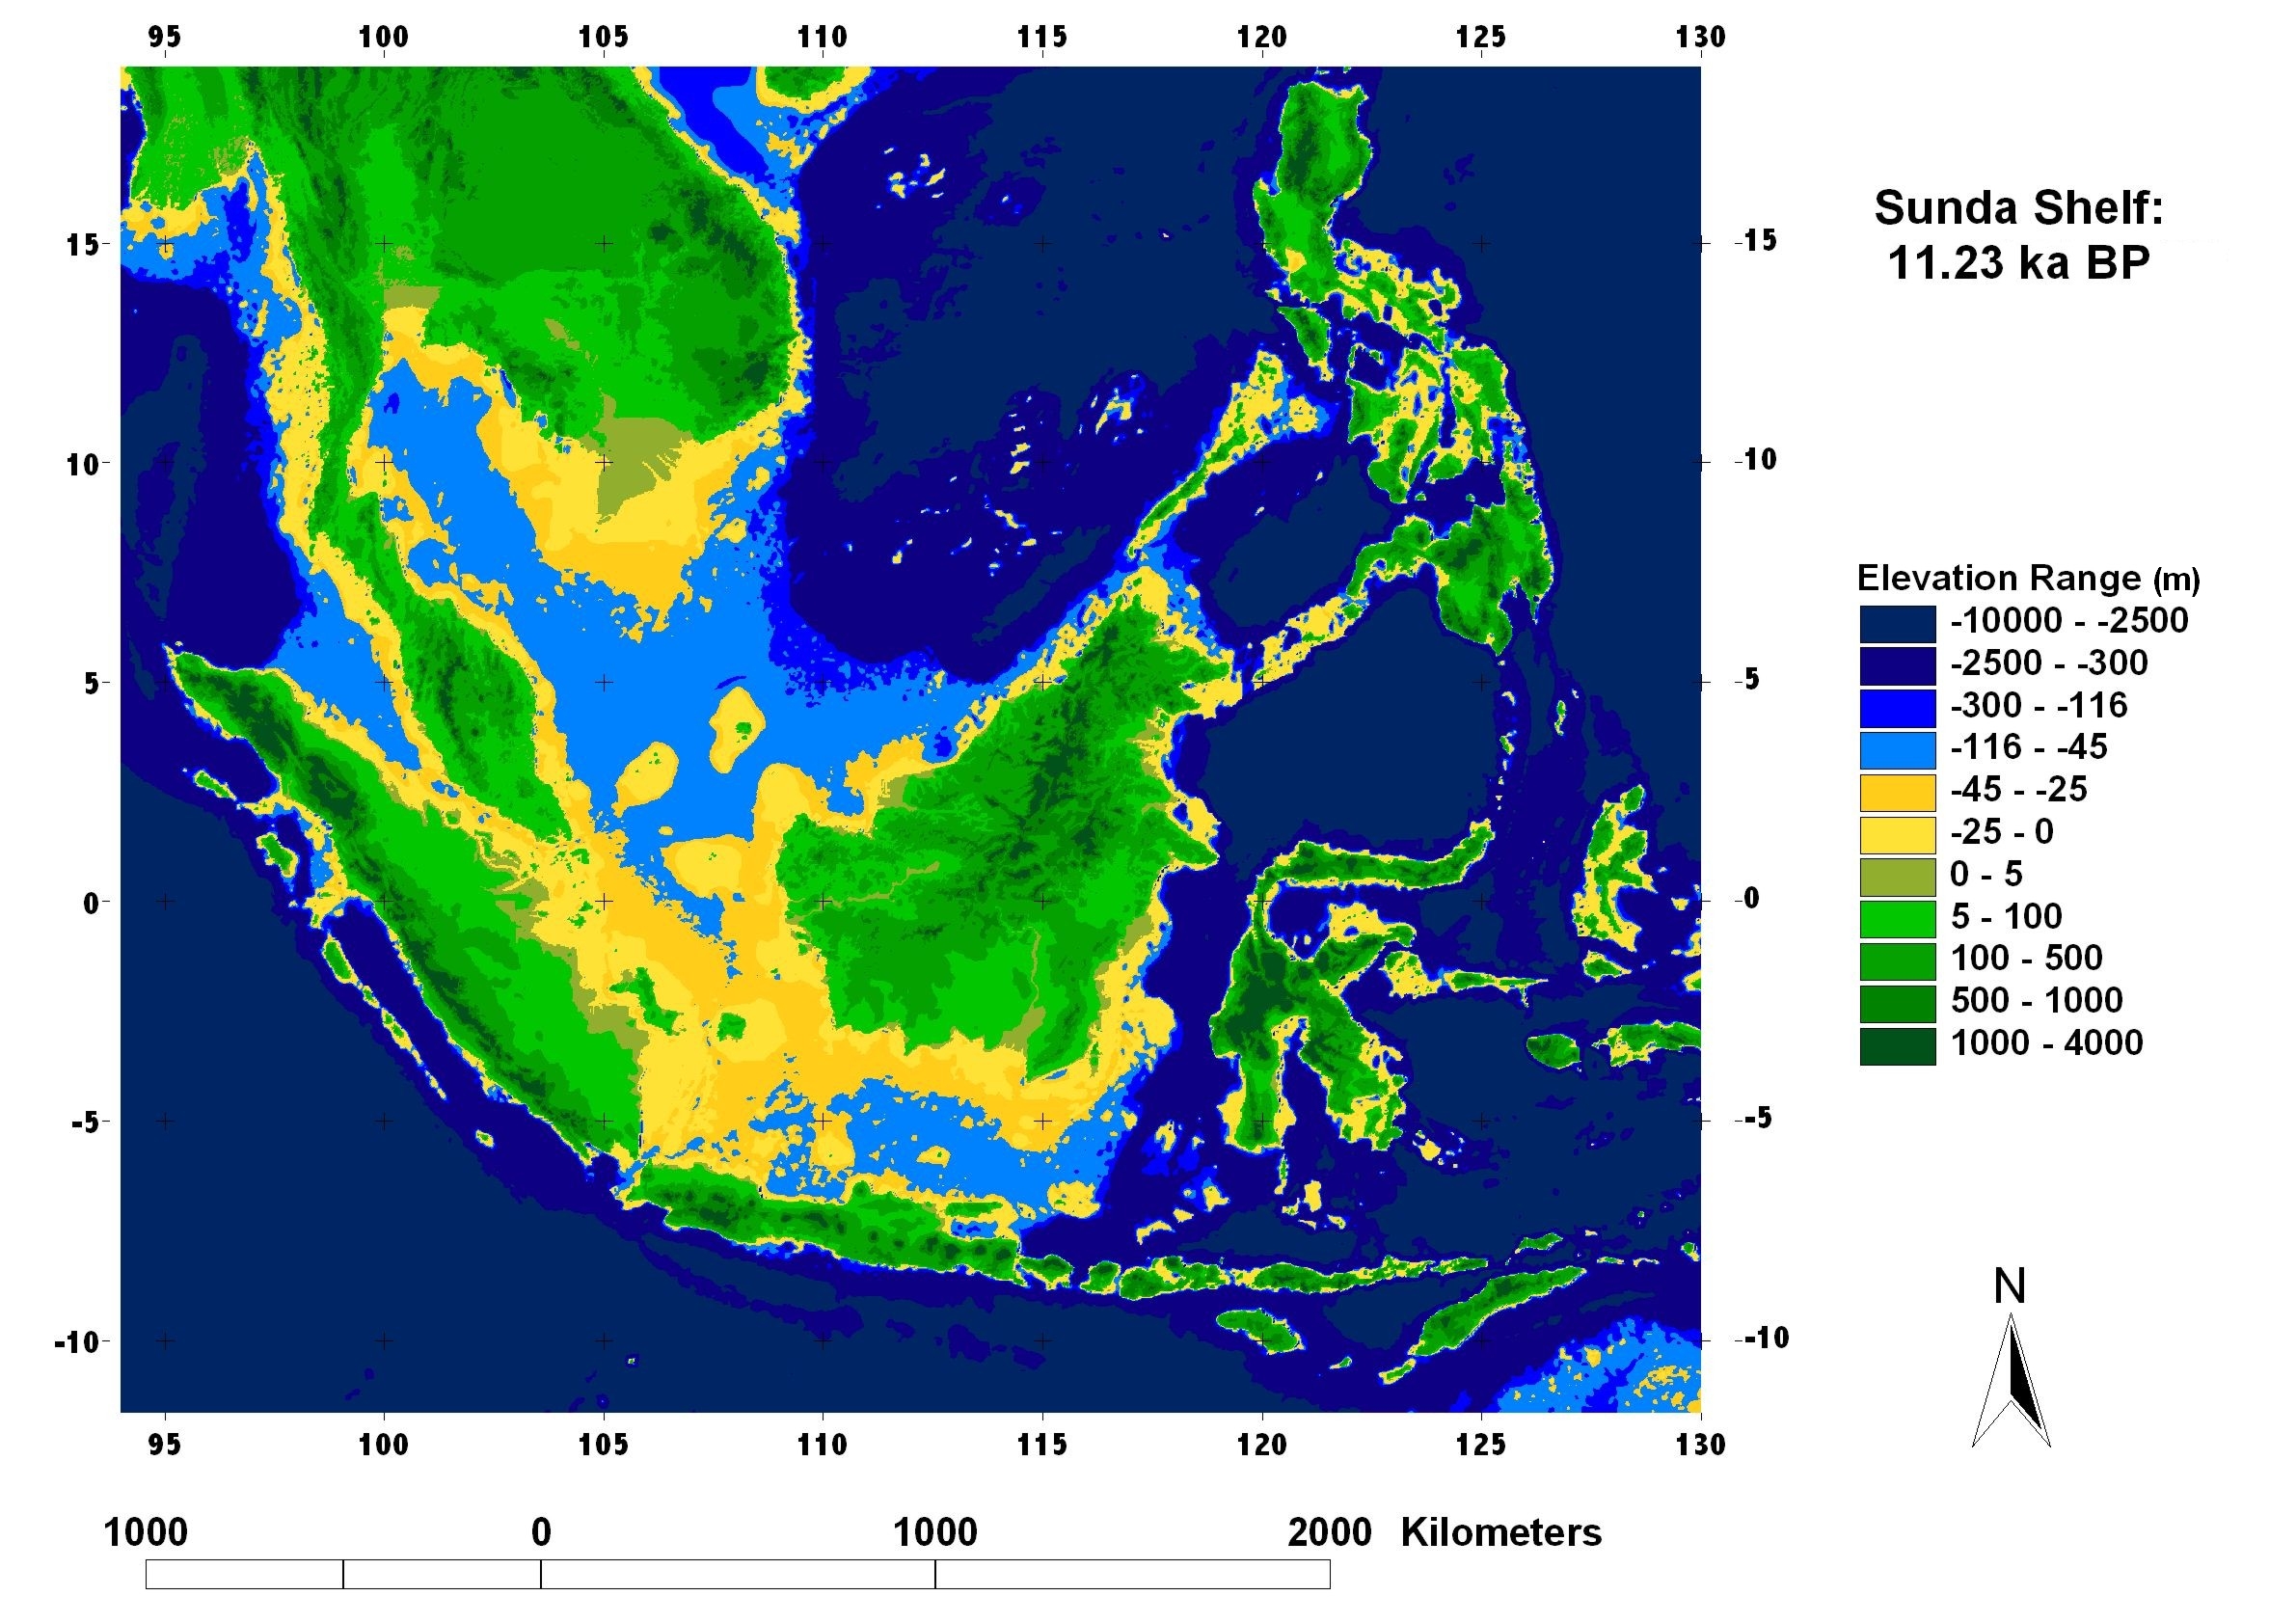
Figure 17 Sunda Shelf: 10.88 ka BP; -40 m below present-day sea level
Figure 18 Sunda Shelf: 10.55 ka BP; -35 m below present-day sea level
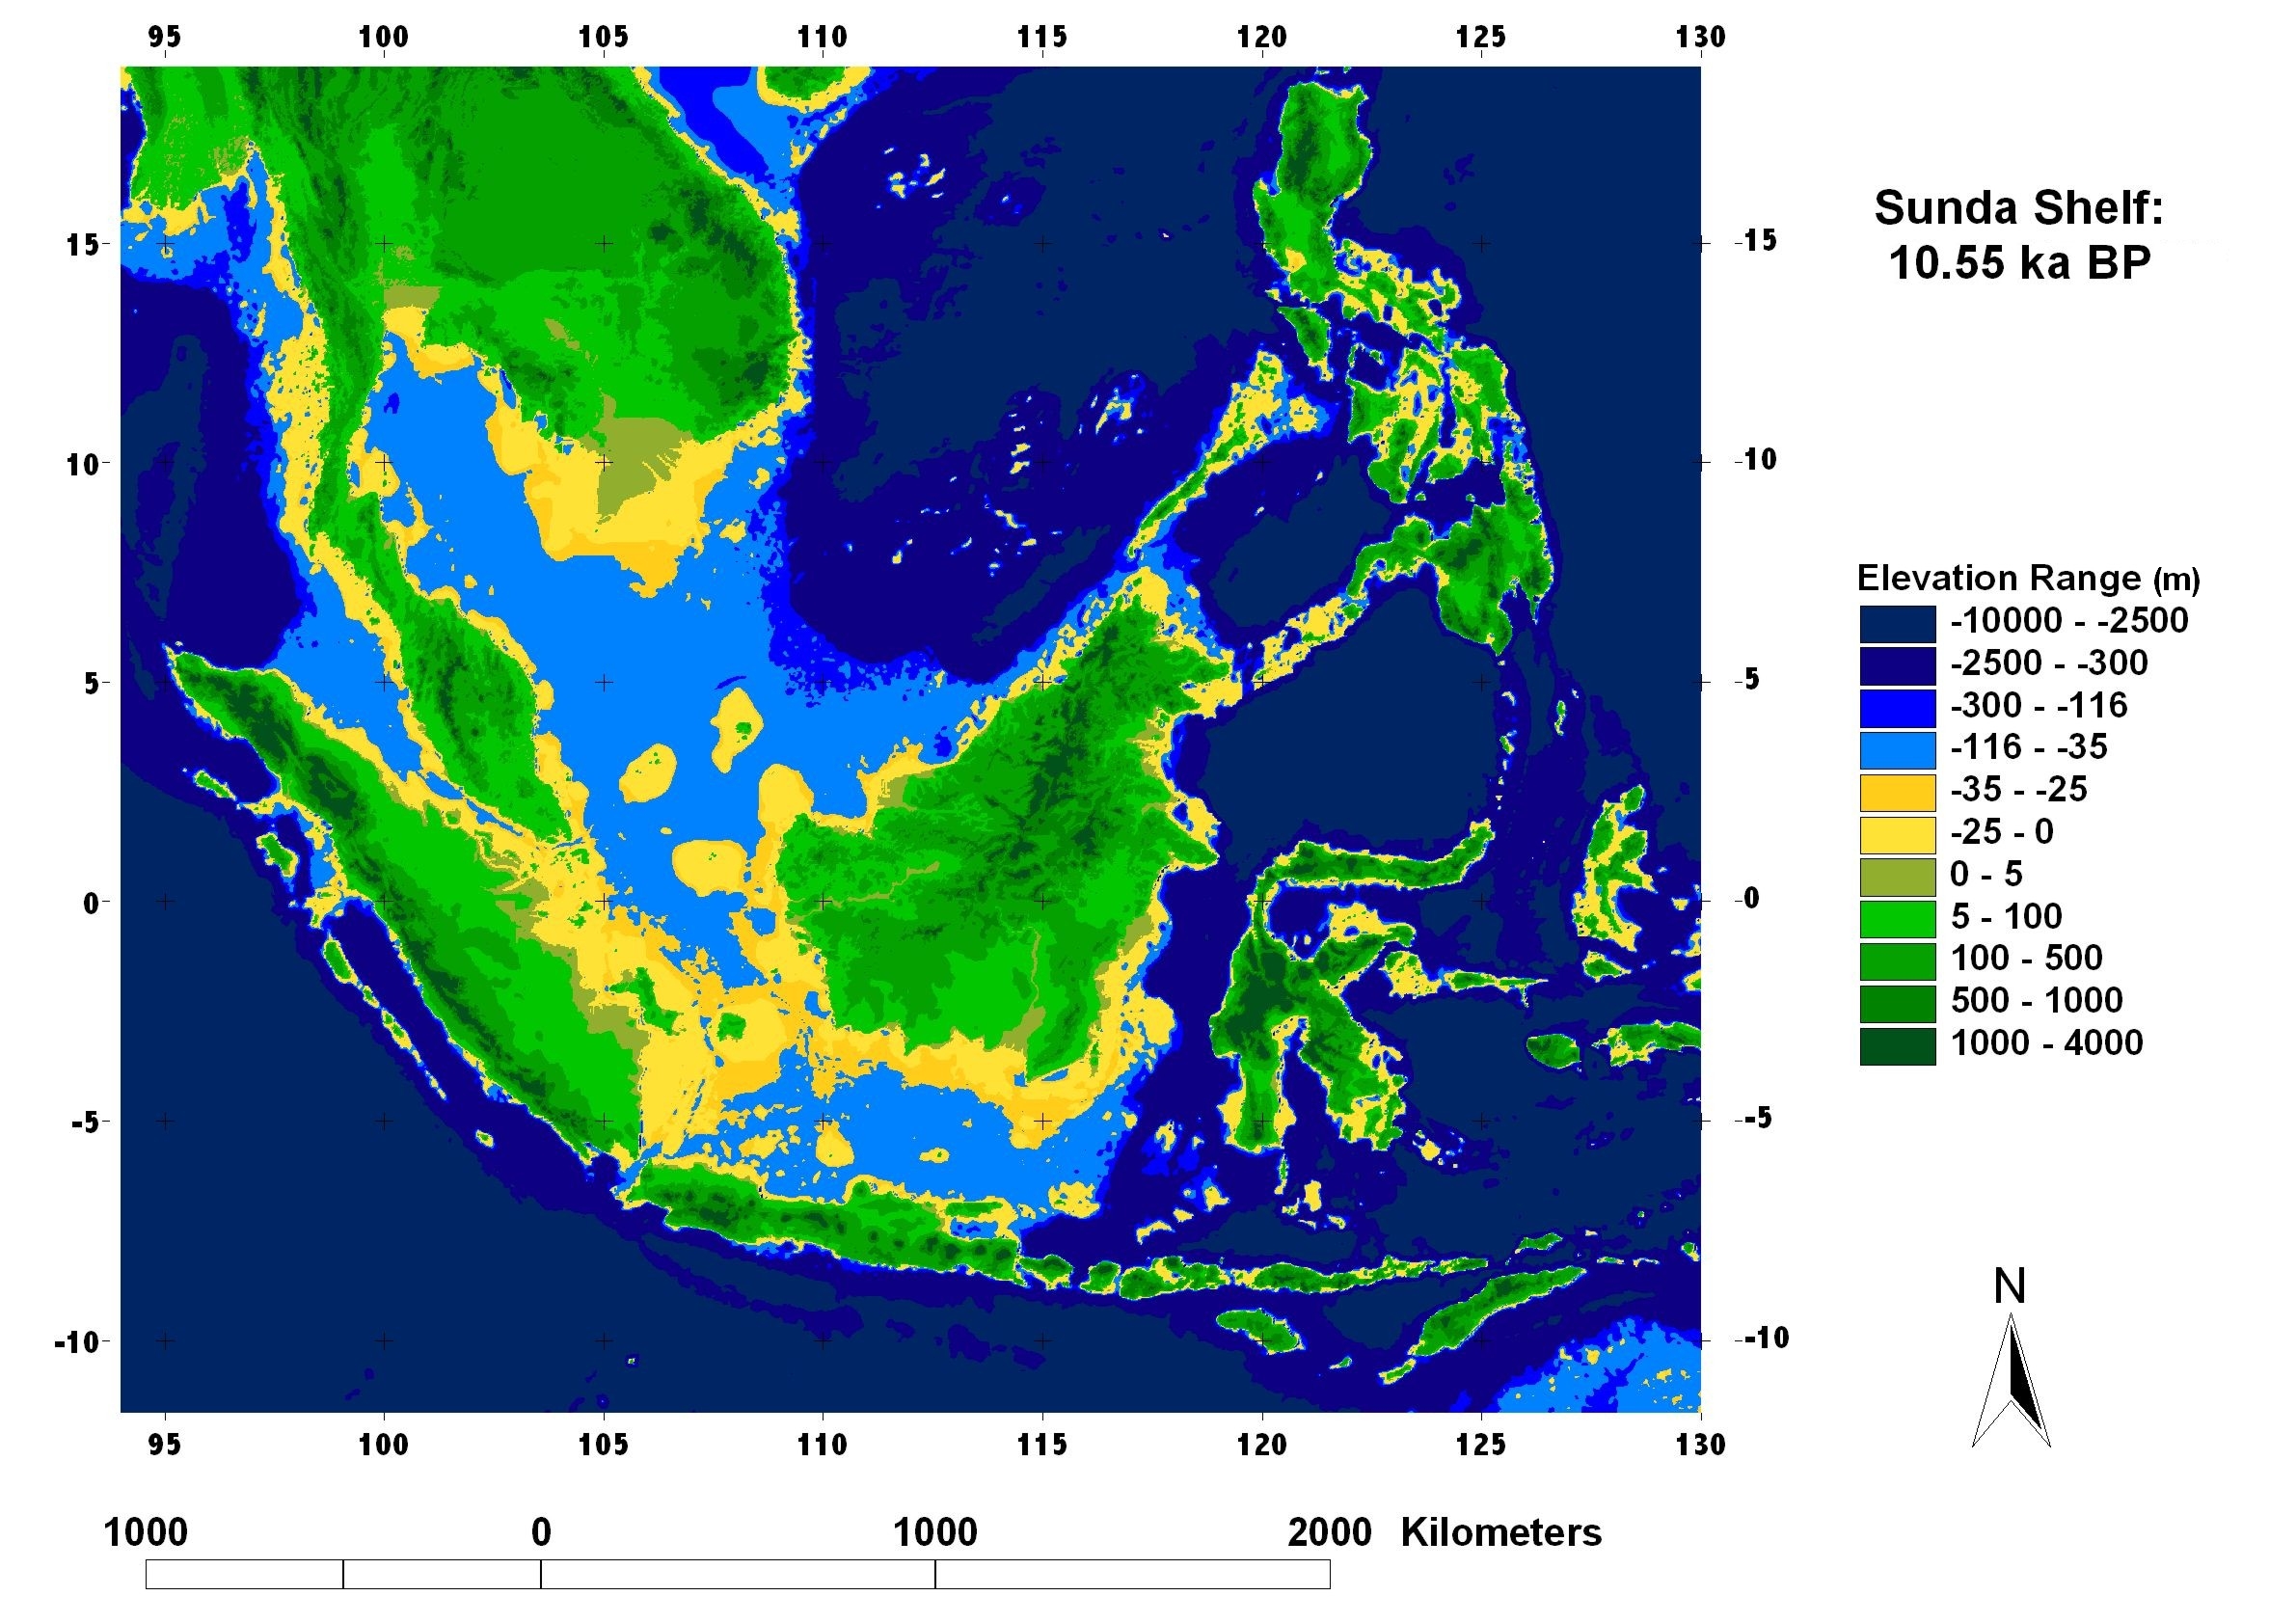
Figure 19 Sunda Shelf: 10.21 ka BP; -30 m below present-day sea level
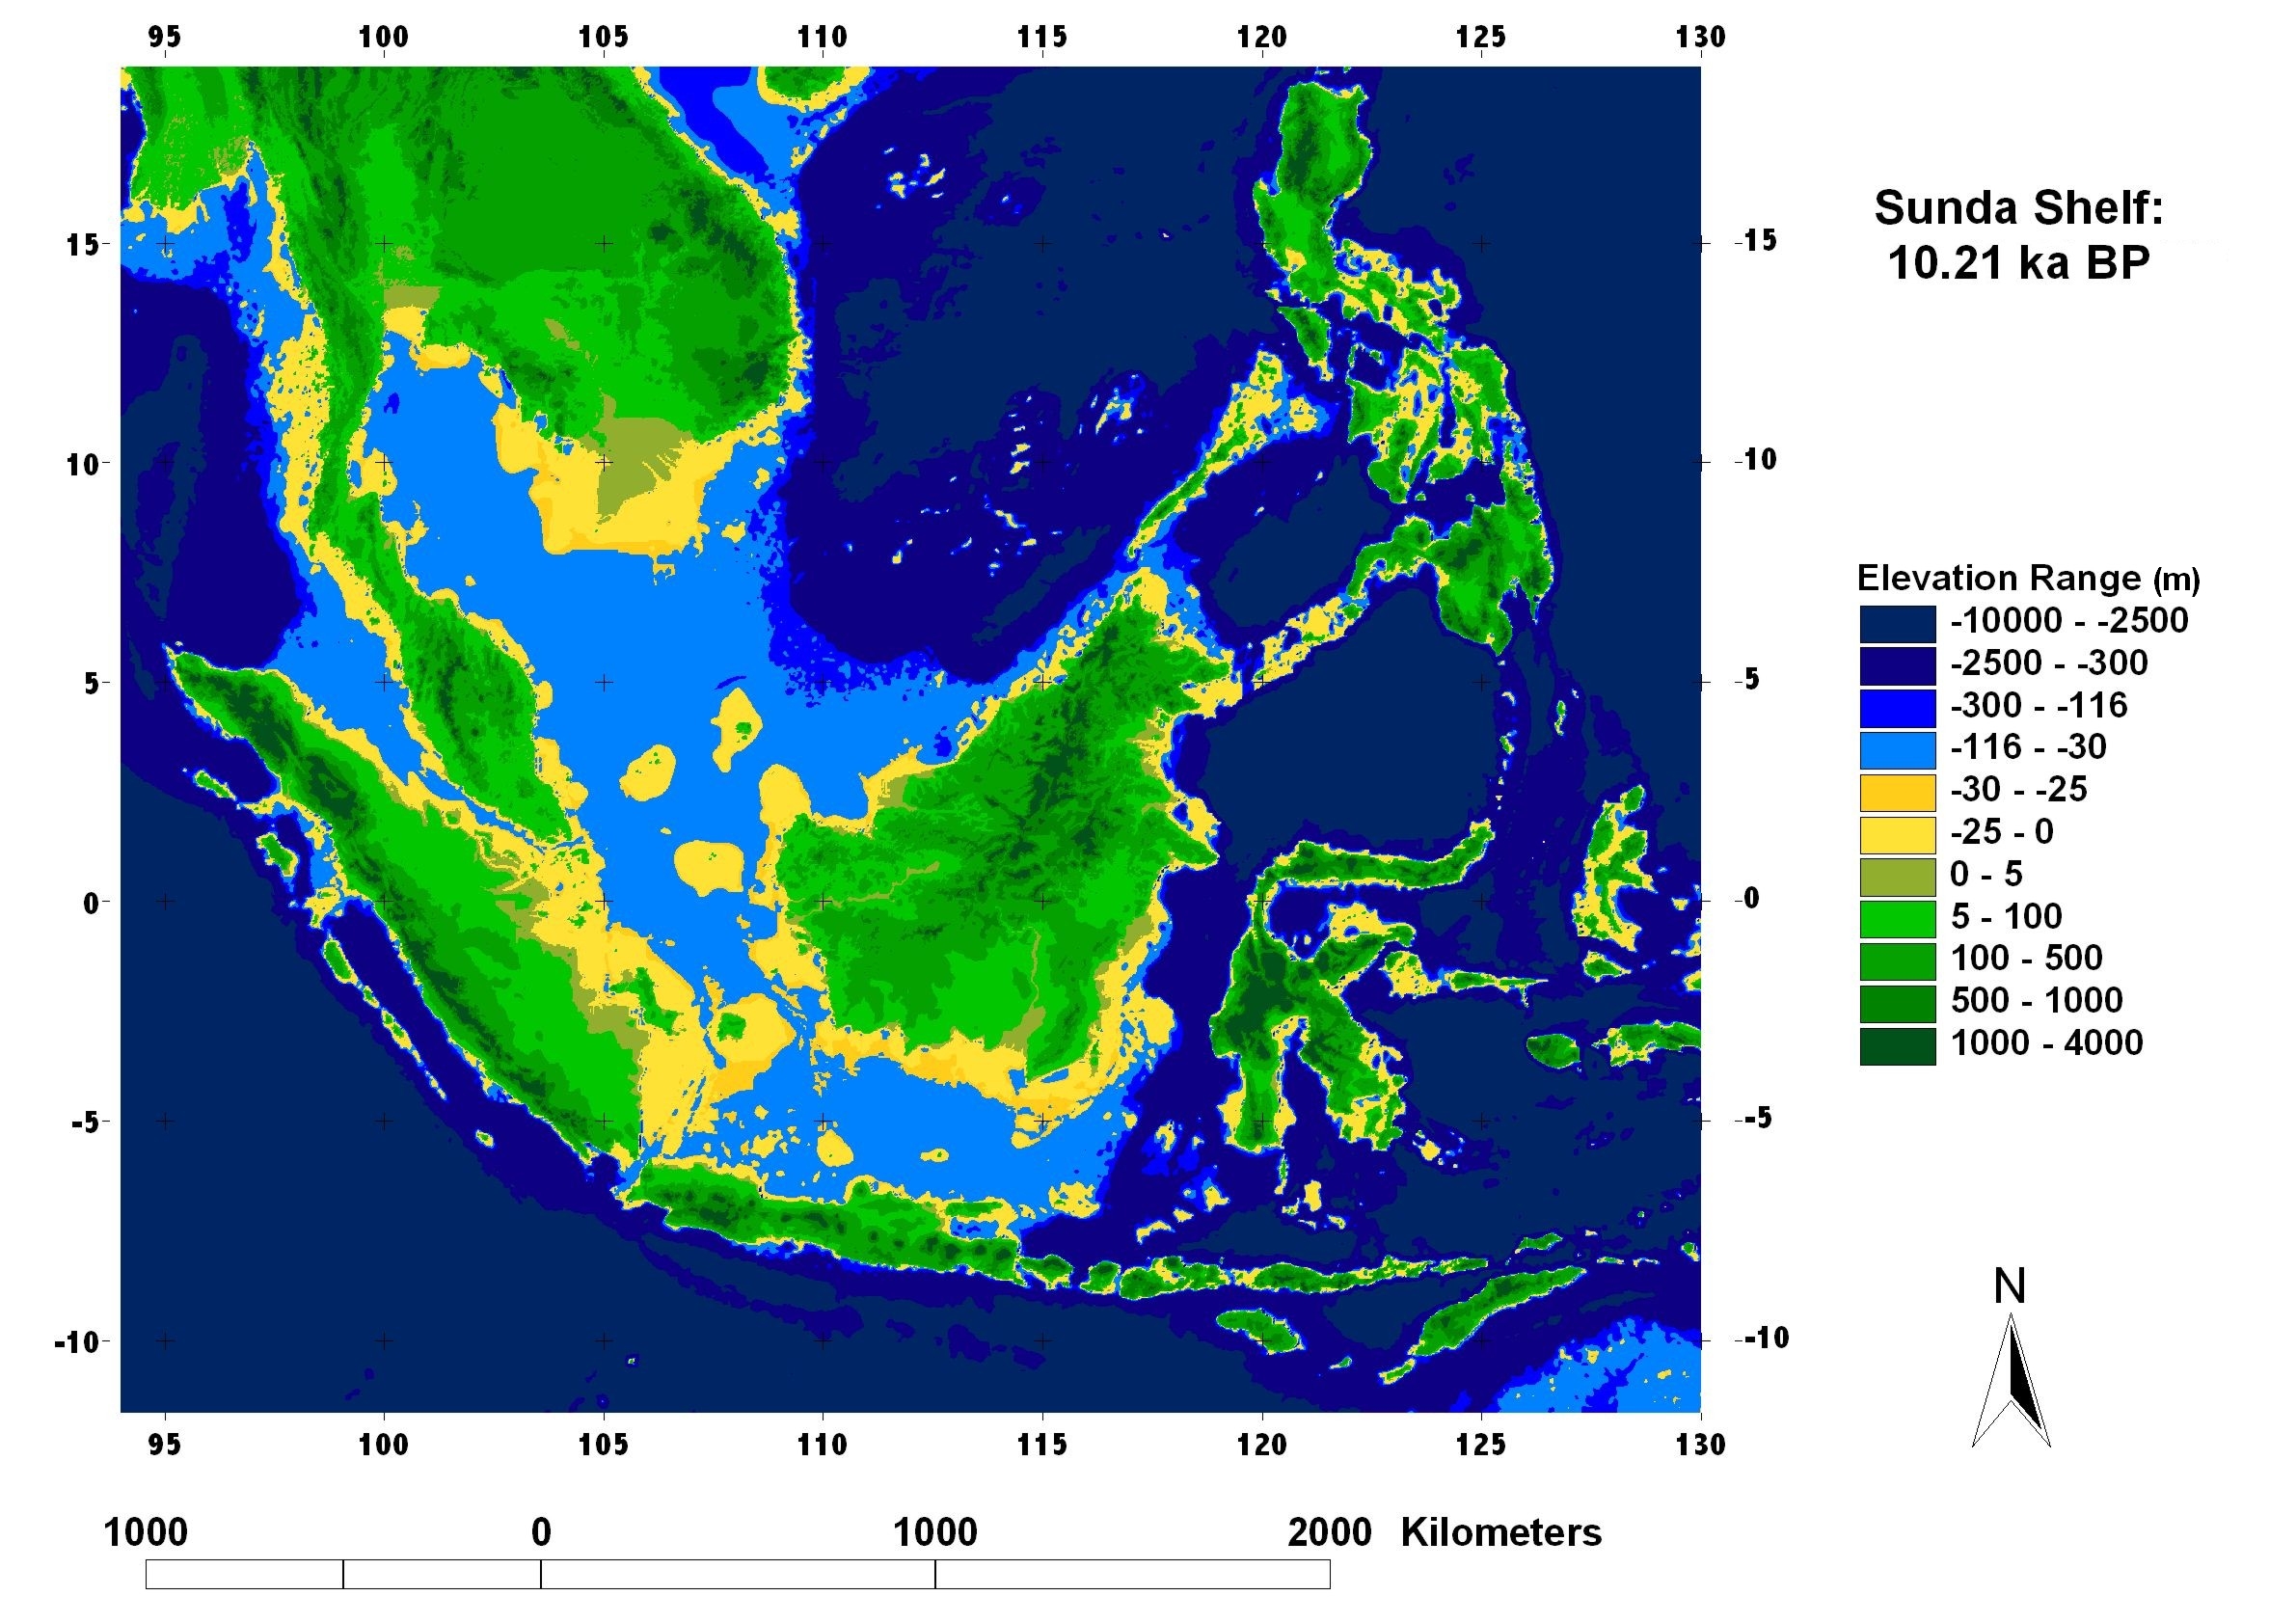
Figure 20 Sunda Shelf: 9.87 ka BP; -25 m below present-day sea level
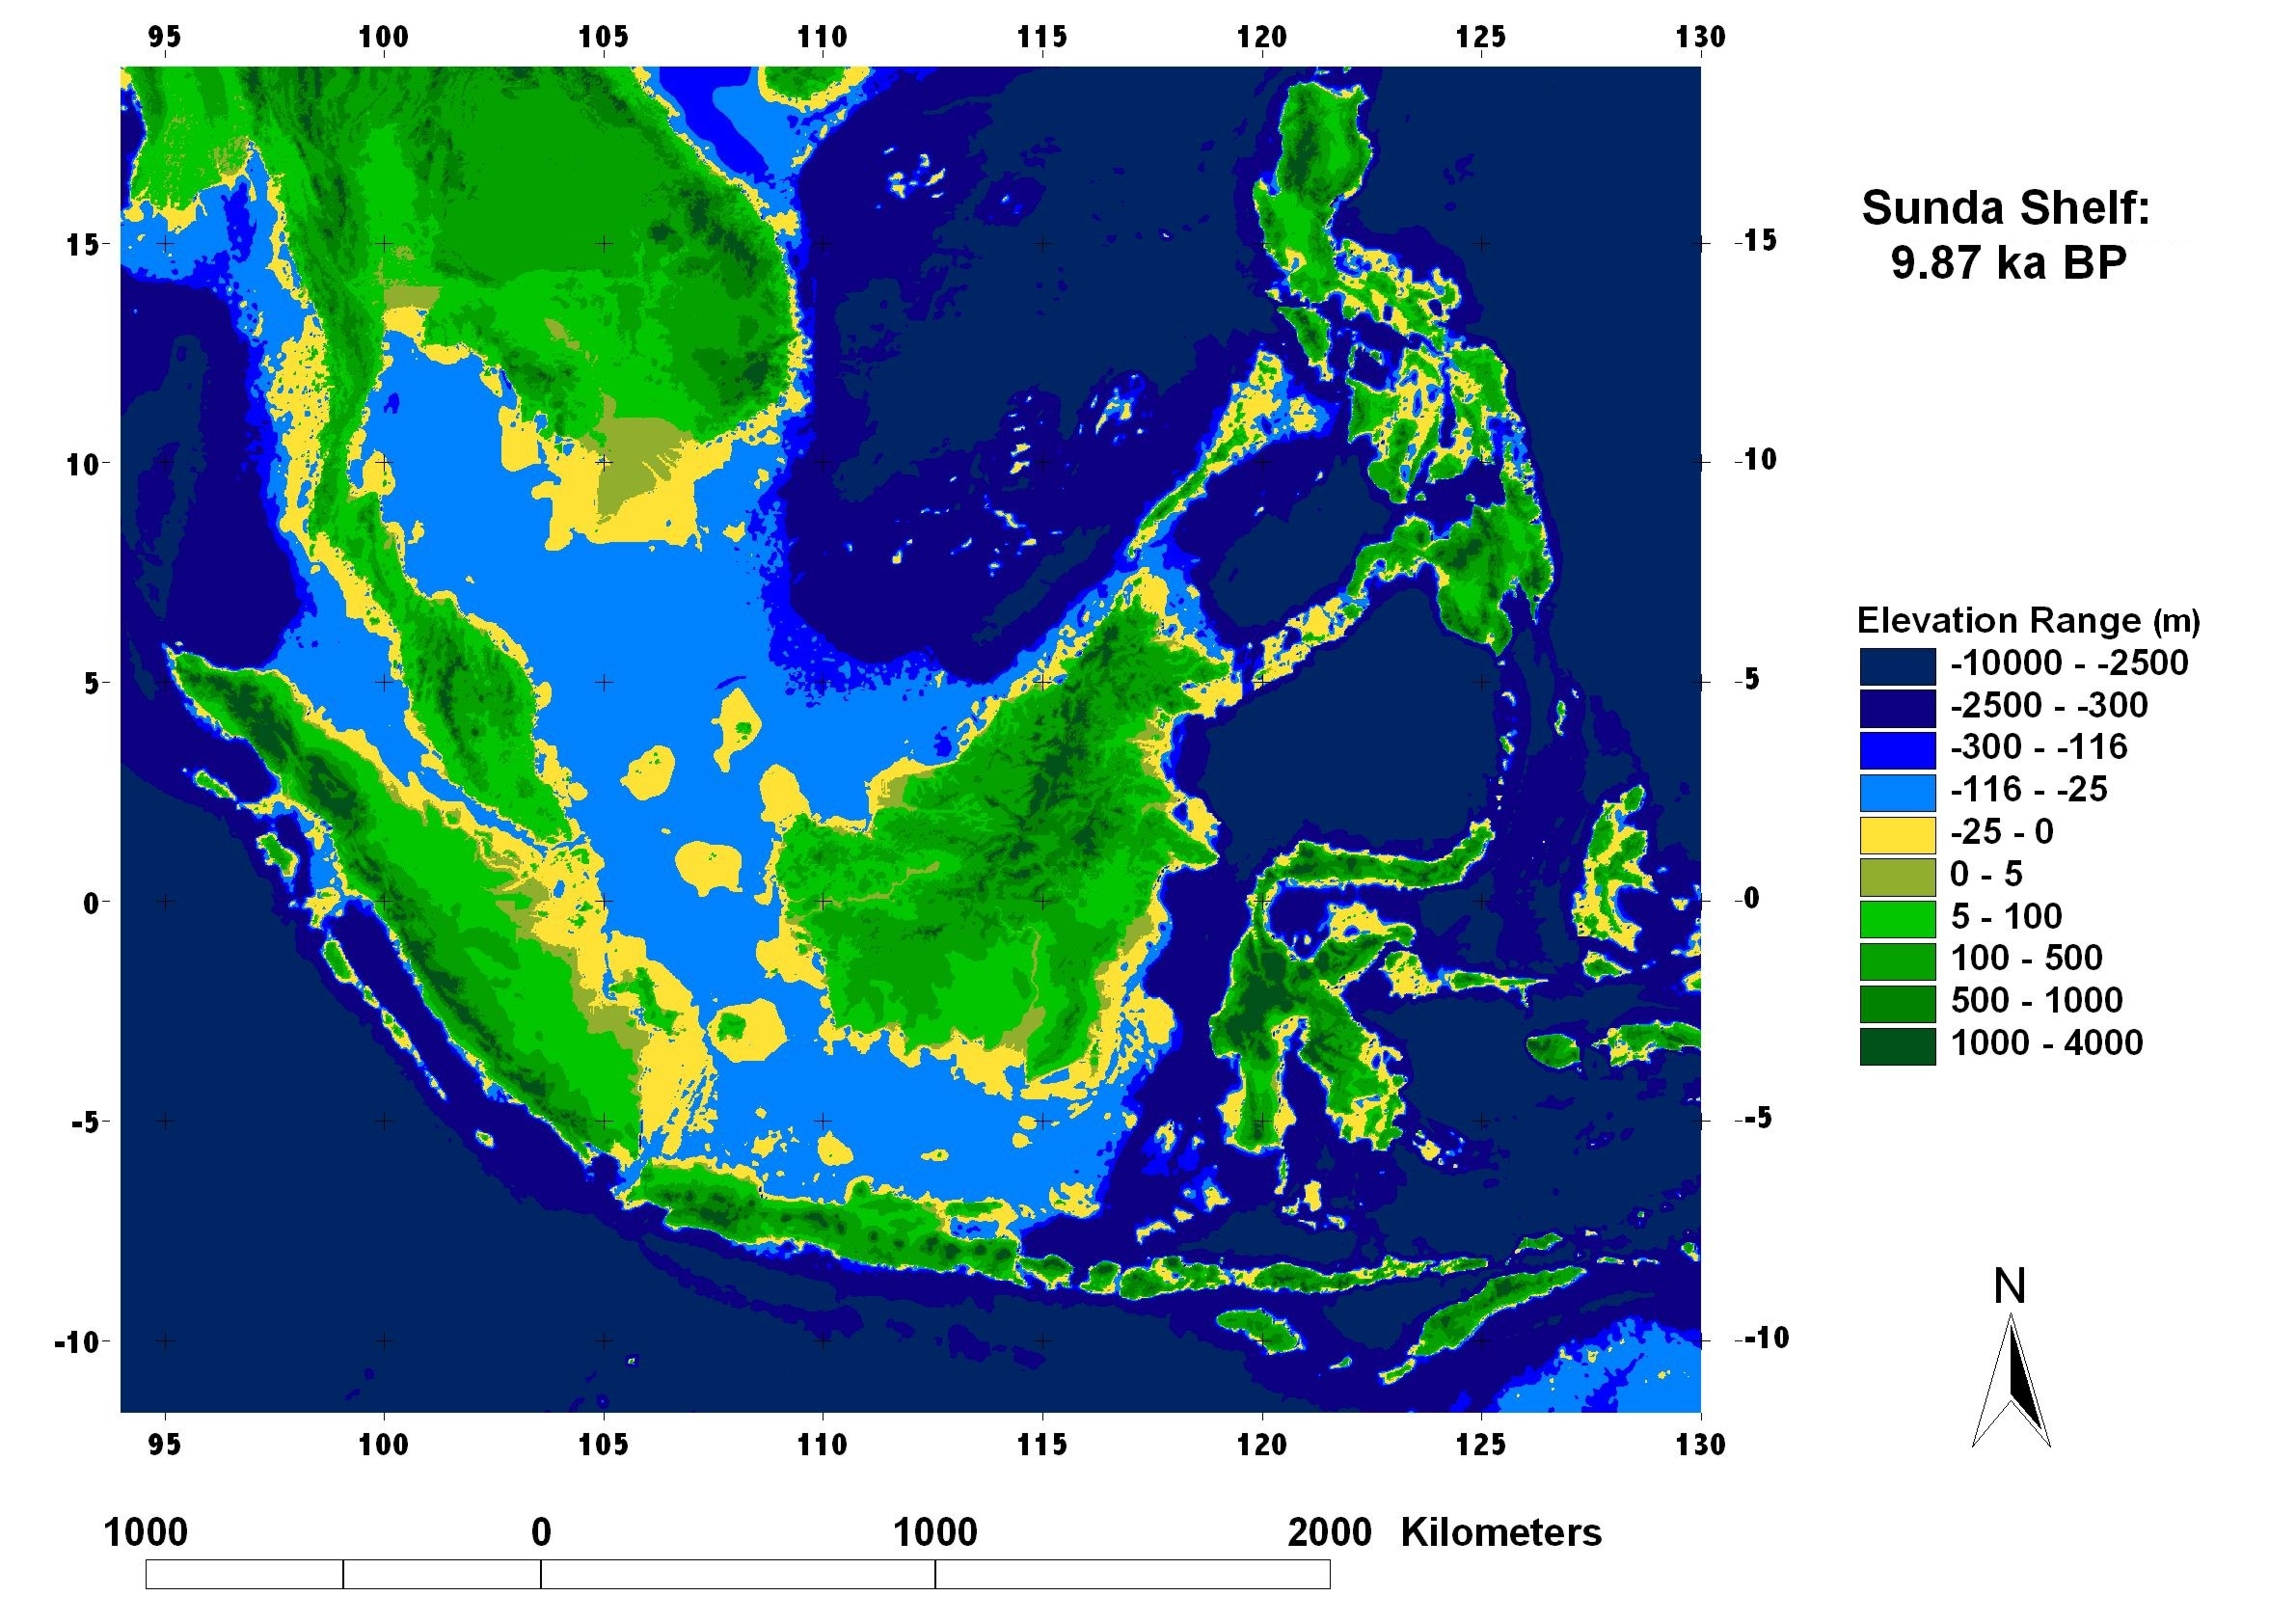
Figure 21 Sunda Shelf: 9.53 ka BP; -20 m below present-day sea level
Figure 22 Sunda Shelf: 9.19 ka BP; -15 m below present-day sea level
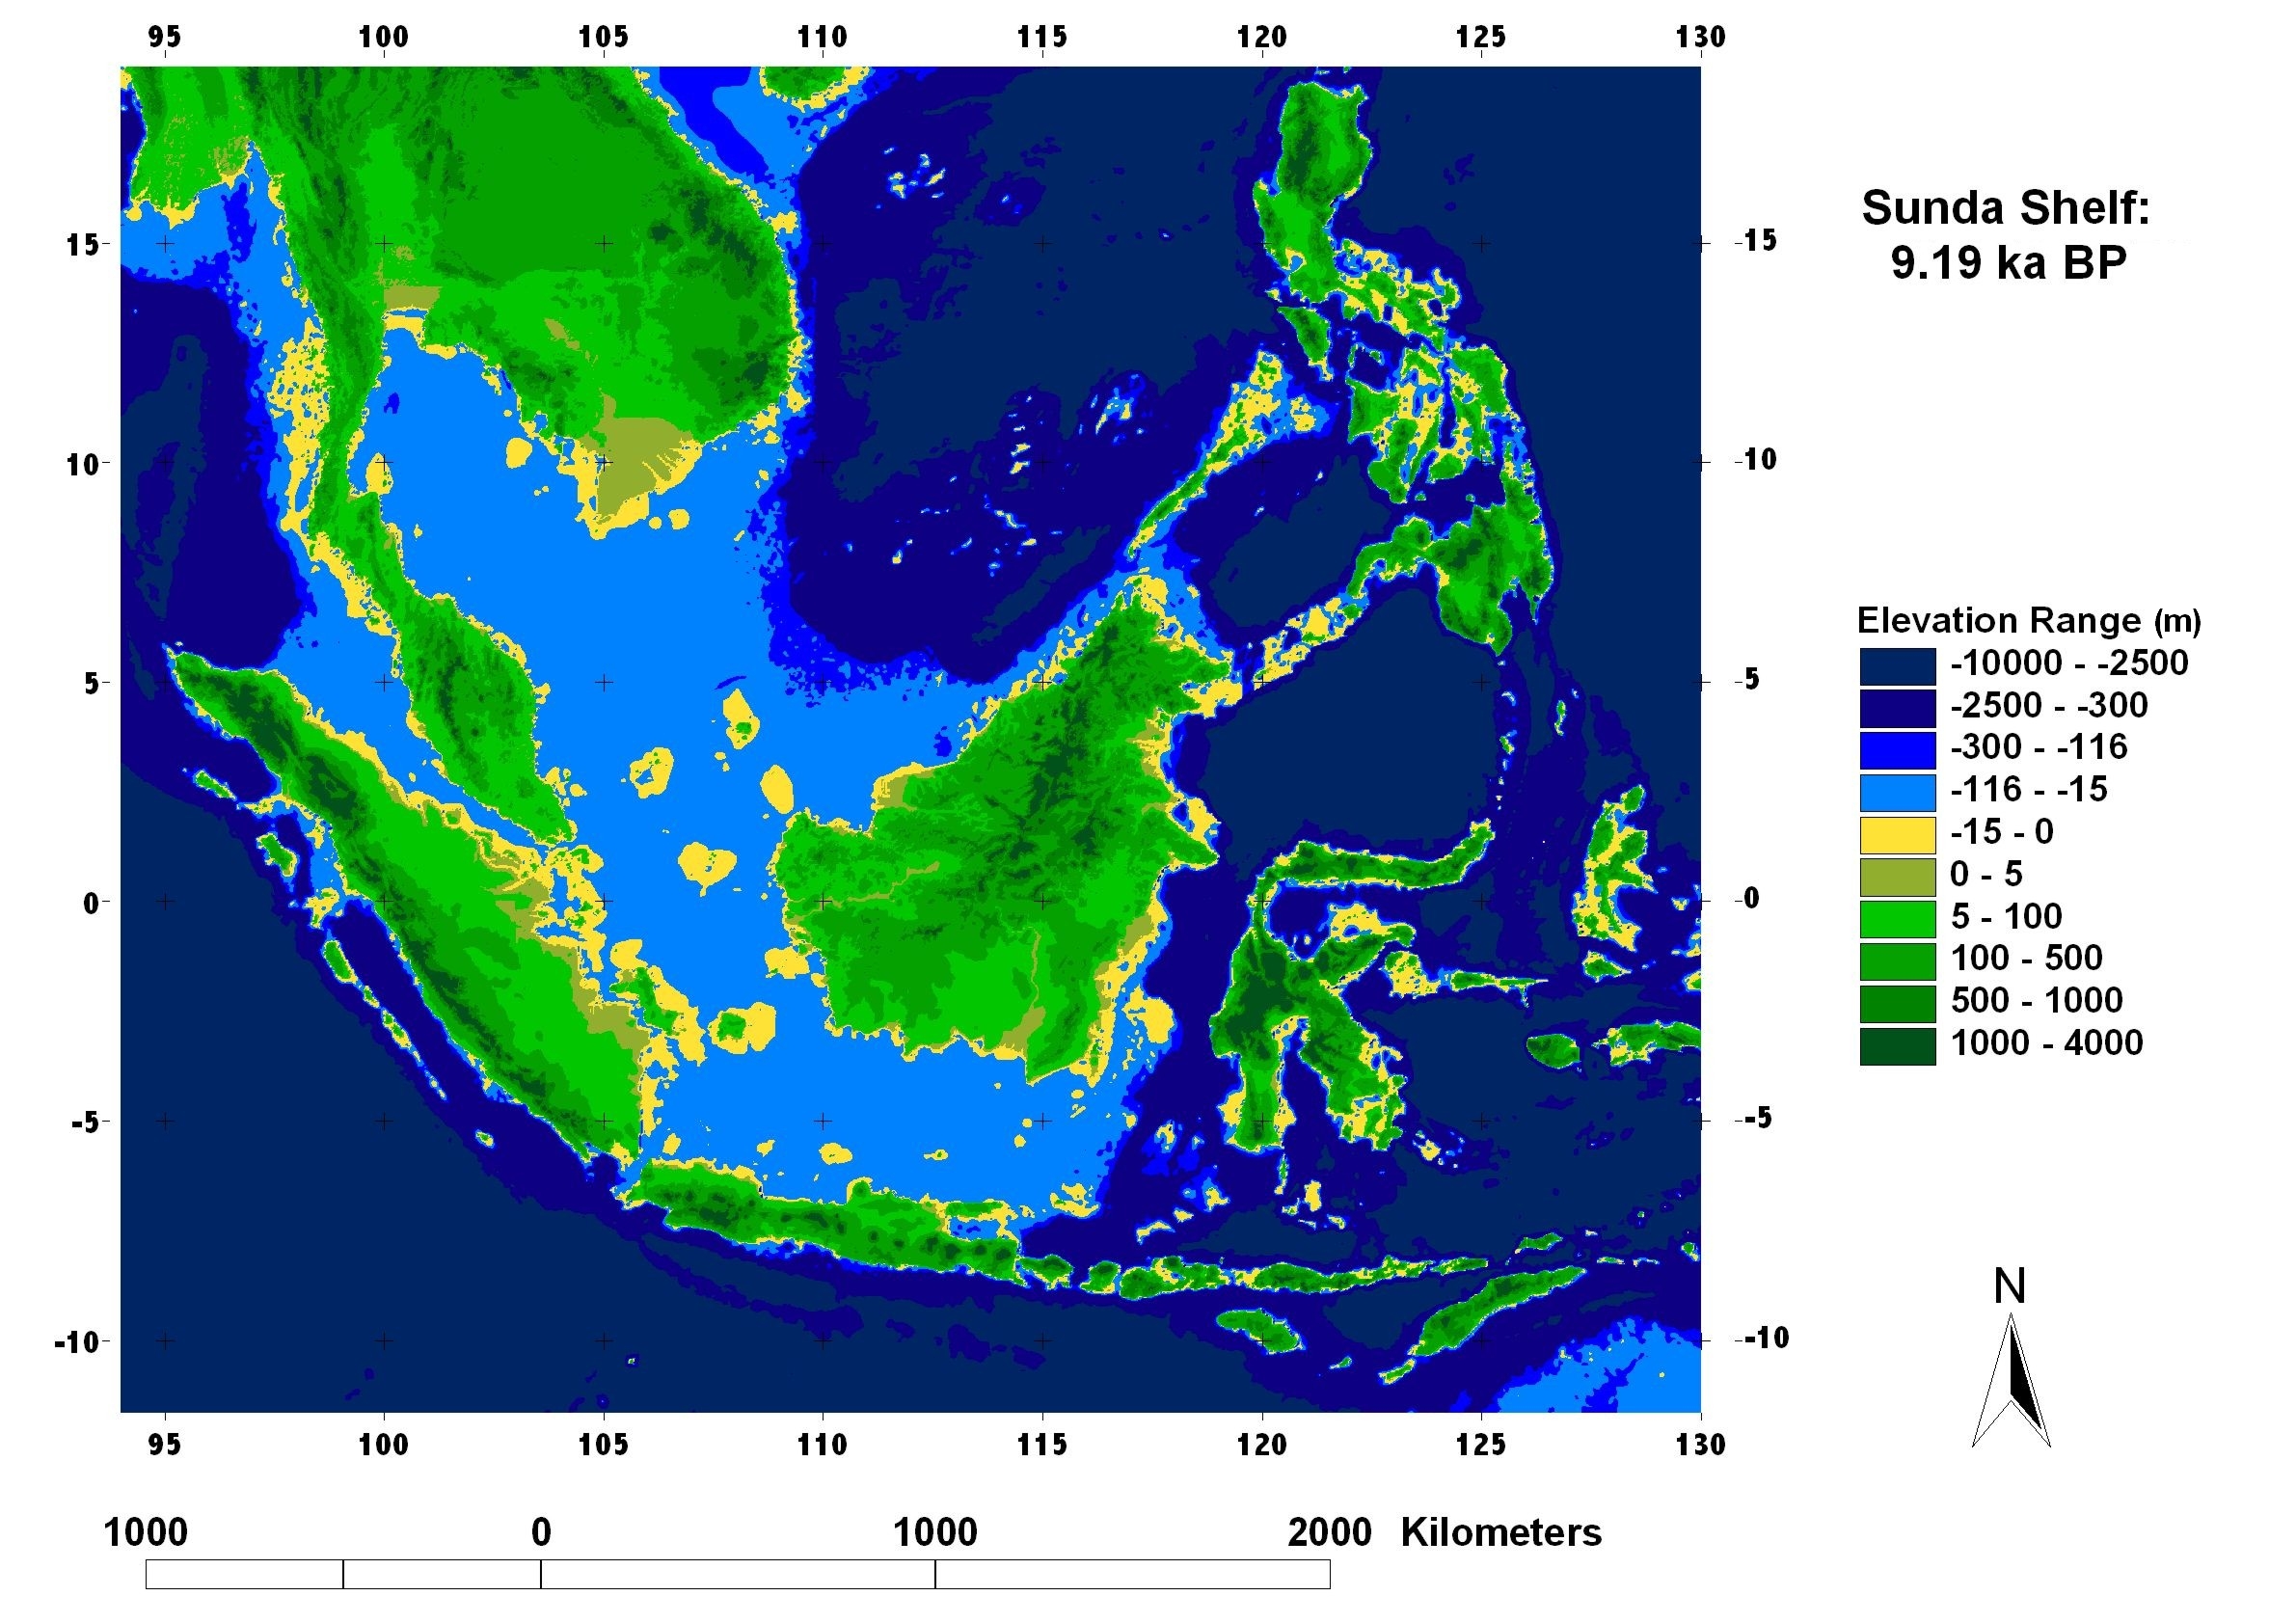
Figure 23 Sunda Shelf: 8.38 ka BP; -10 m below present-day sea level
Figure 24 Sunda Shelf: 7.24 ka BP; -5 m below present-day sea level
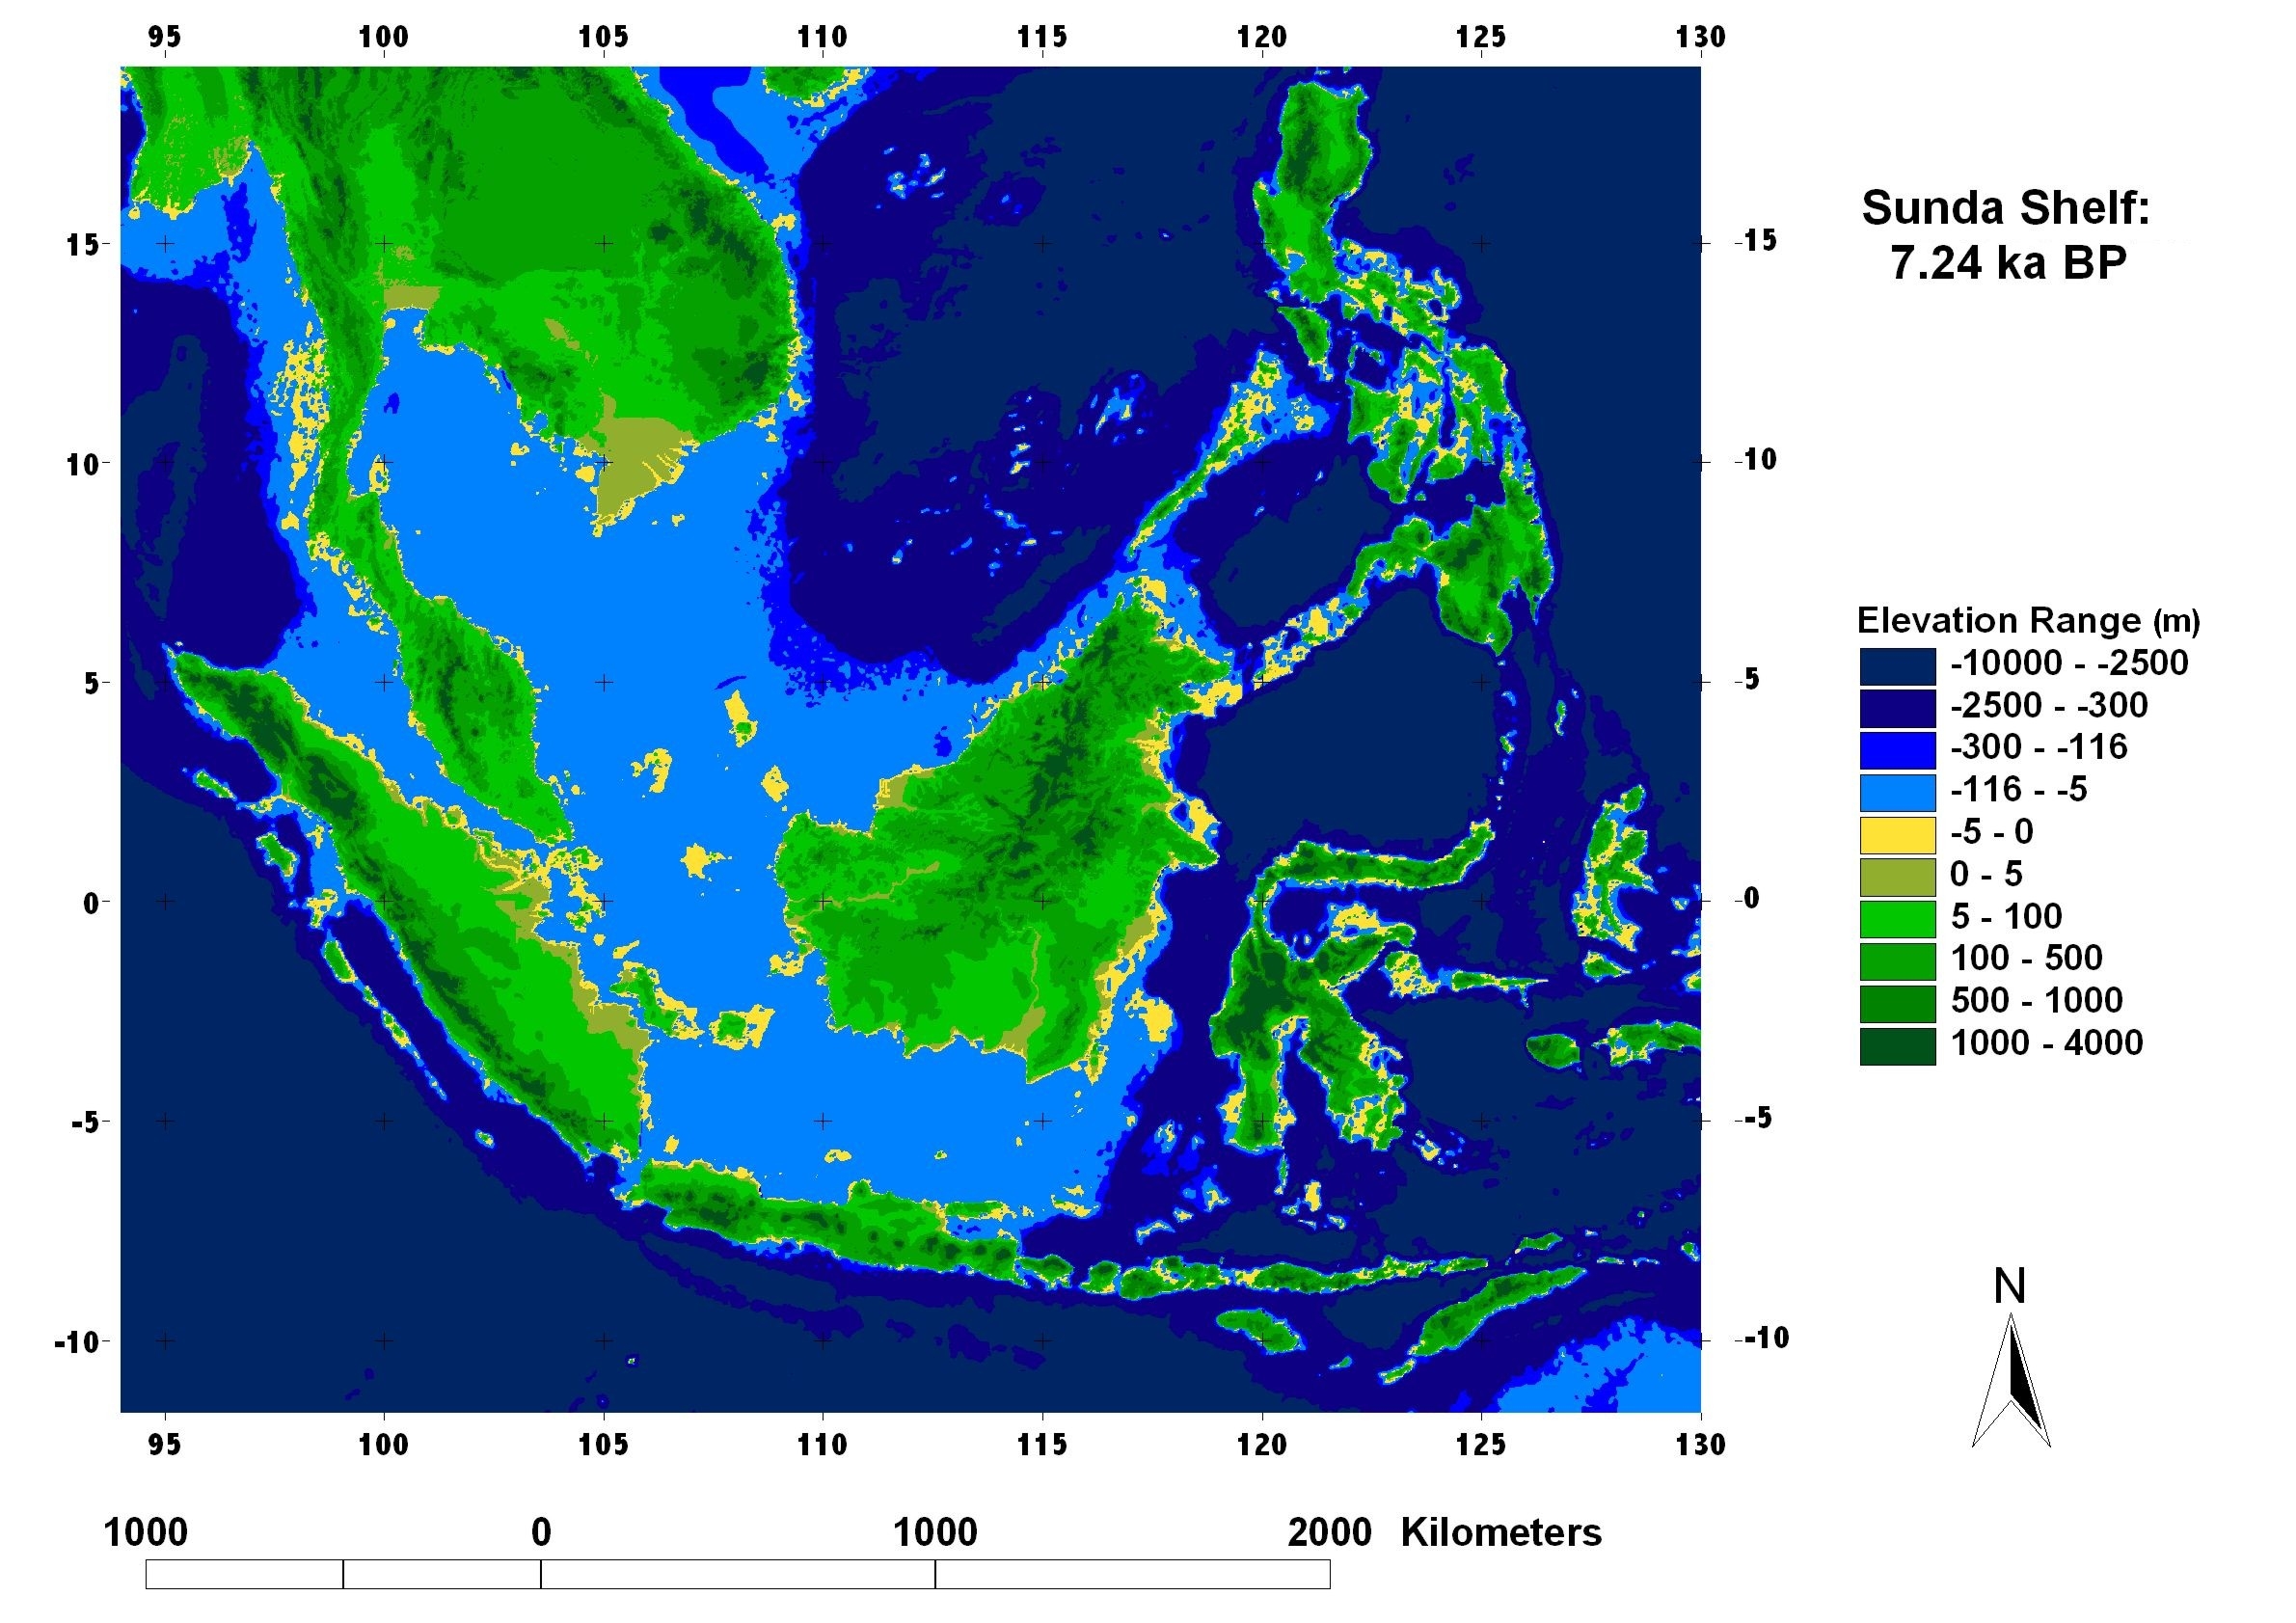
Figure 25 Sunda Shelf: 6.07 ka BP; -0 m below present-day sea level
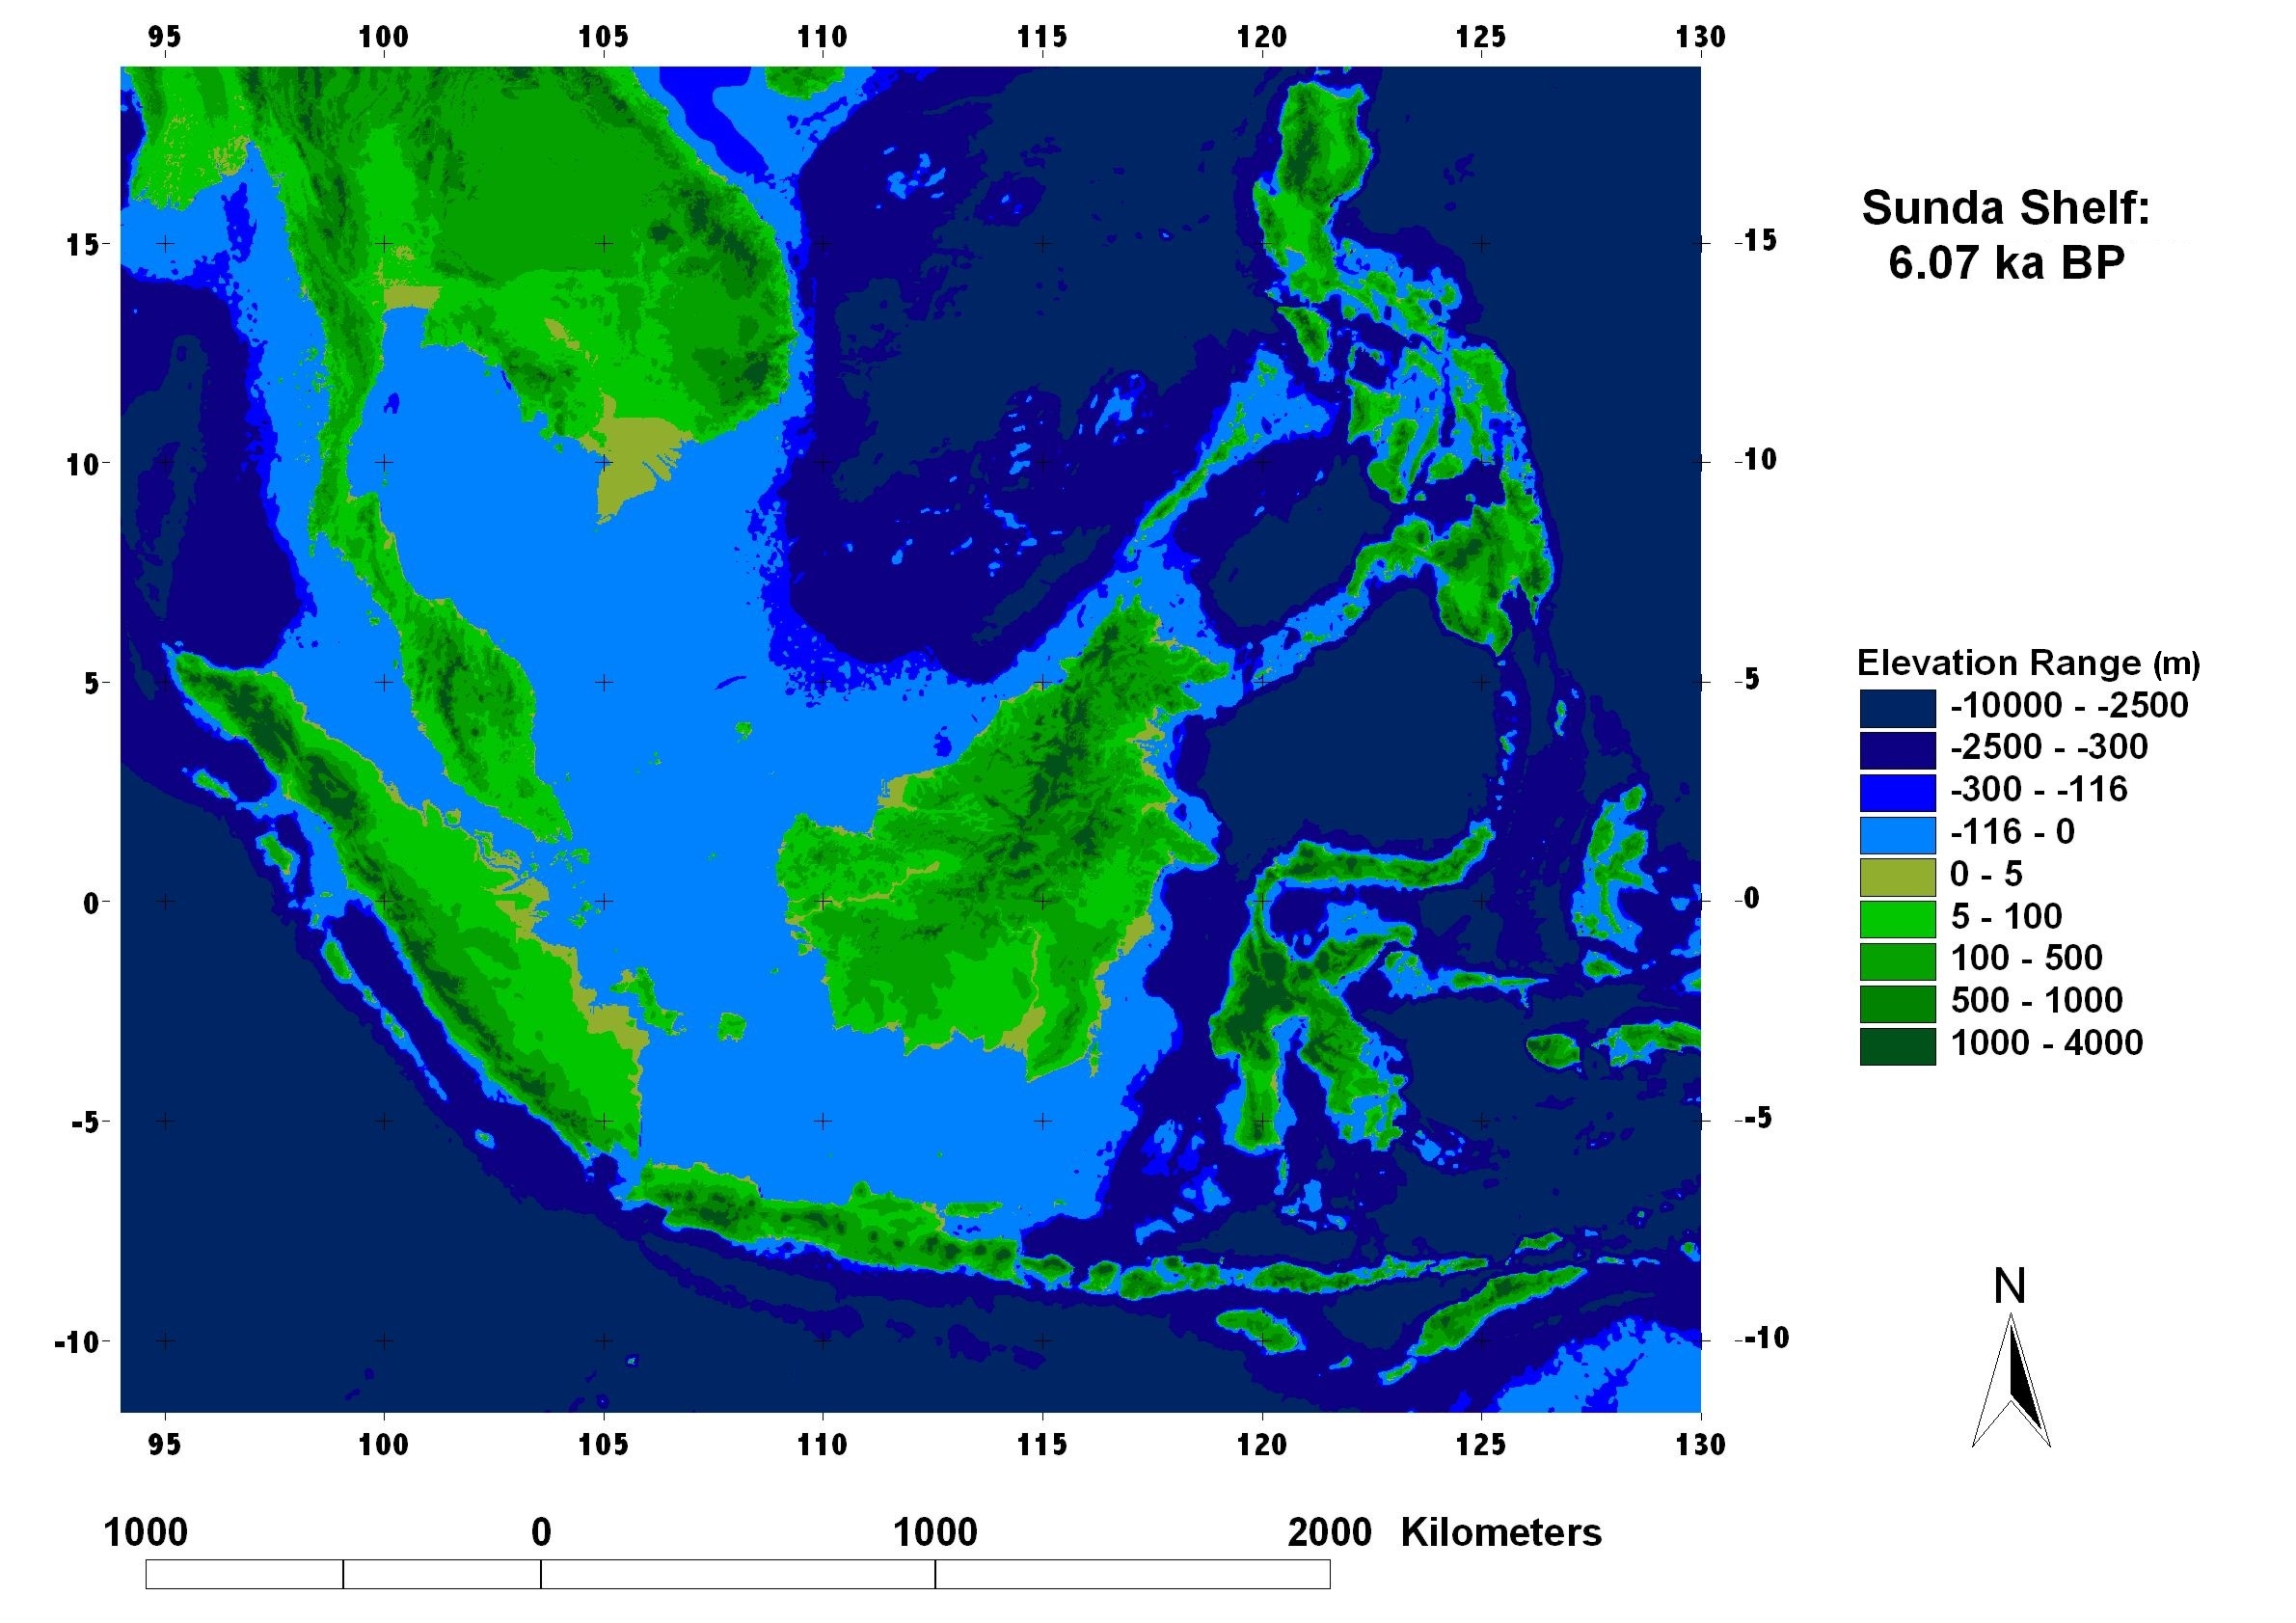
Figure 26 Sunda Shelf: Mid Holocene Highstand, 4.20 ka BP; +5 m above present-day sea level
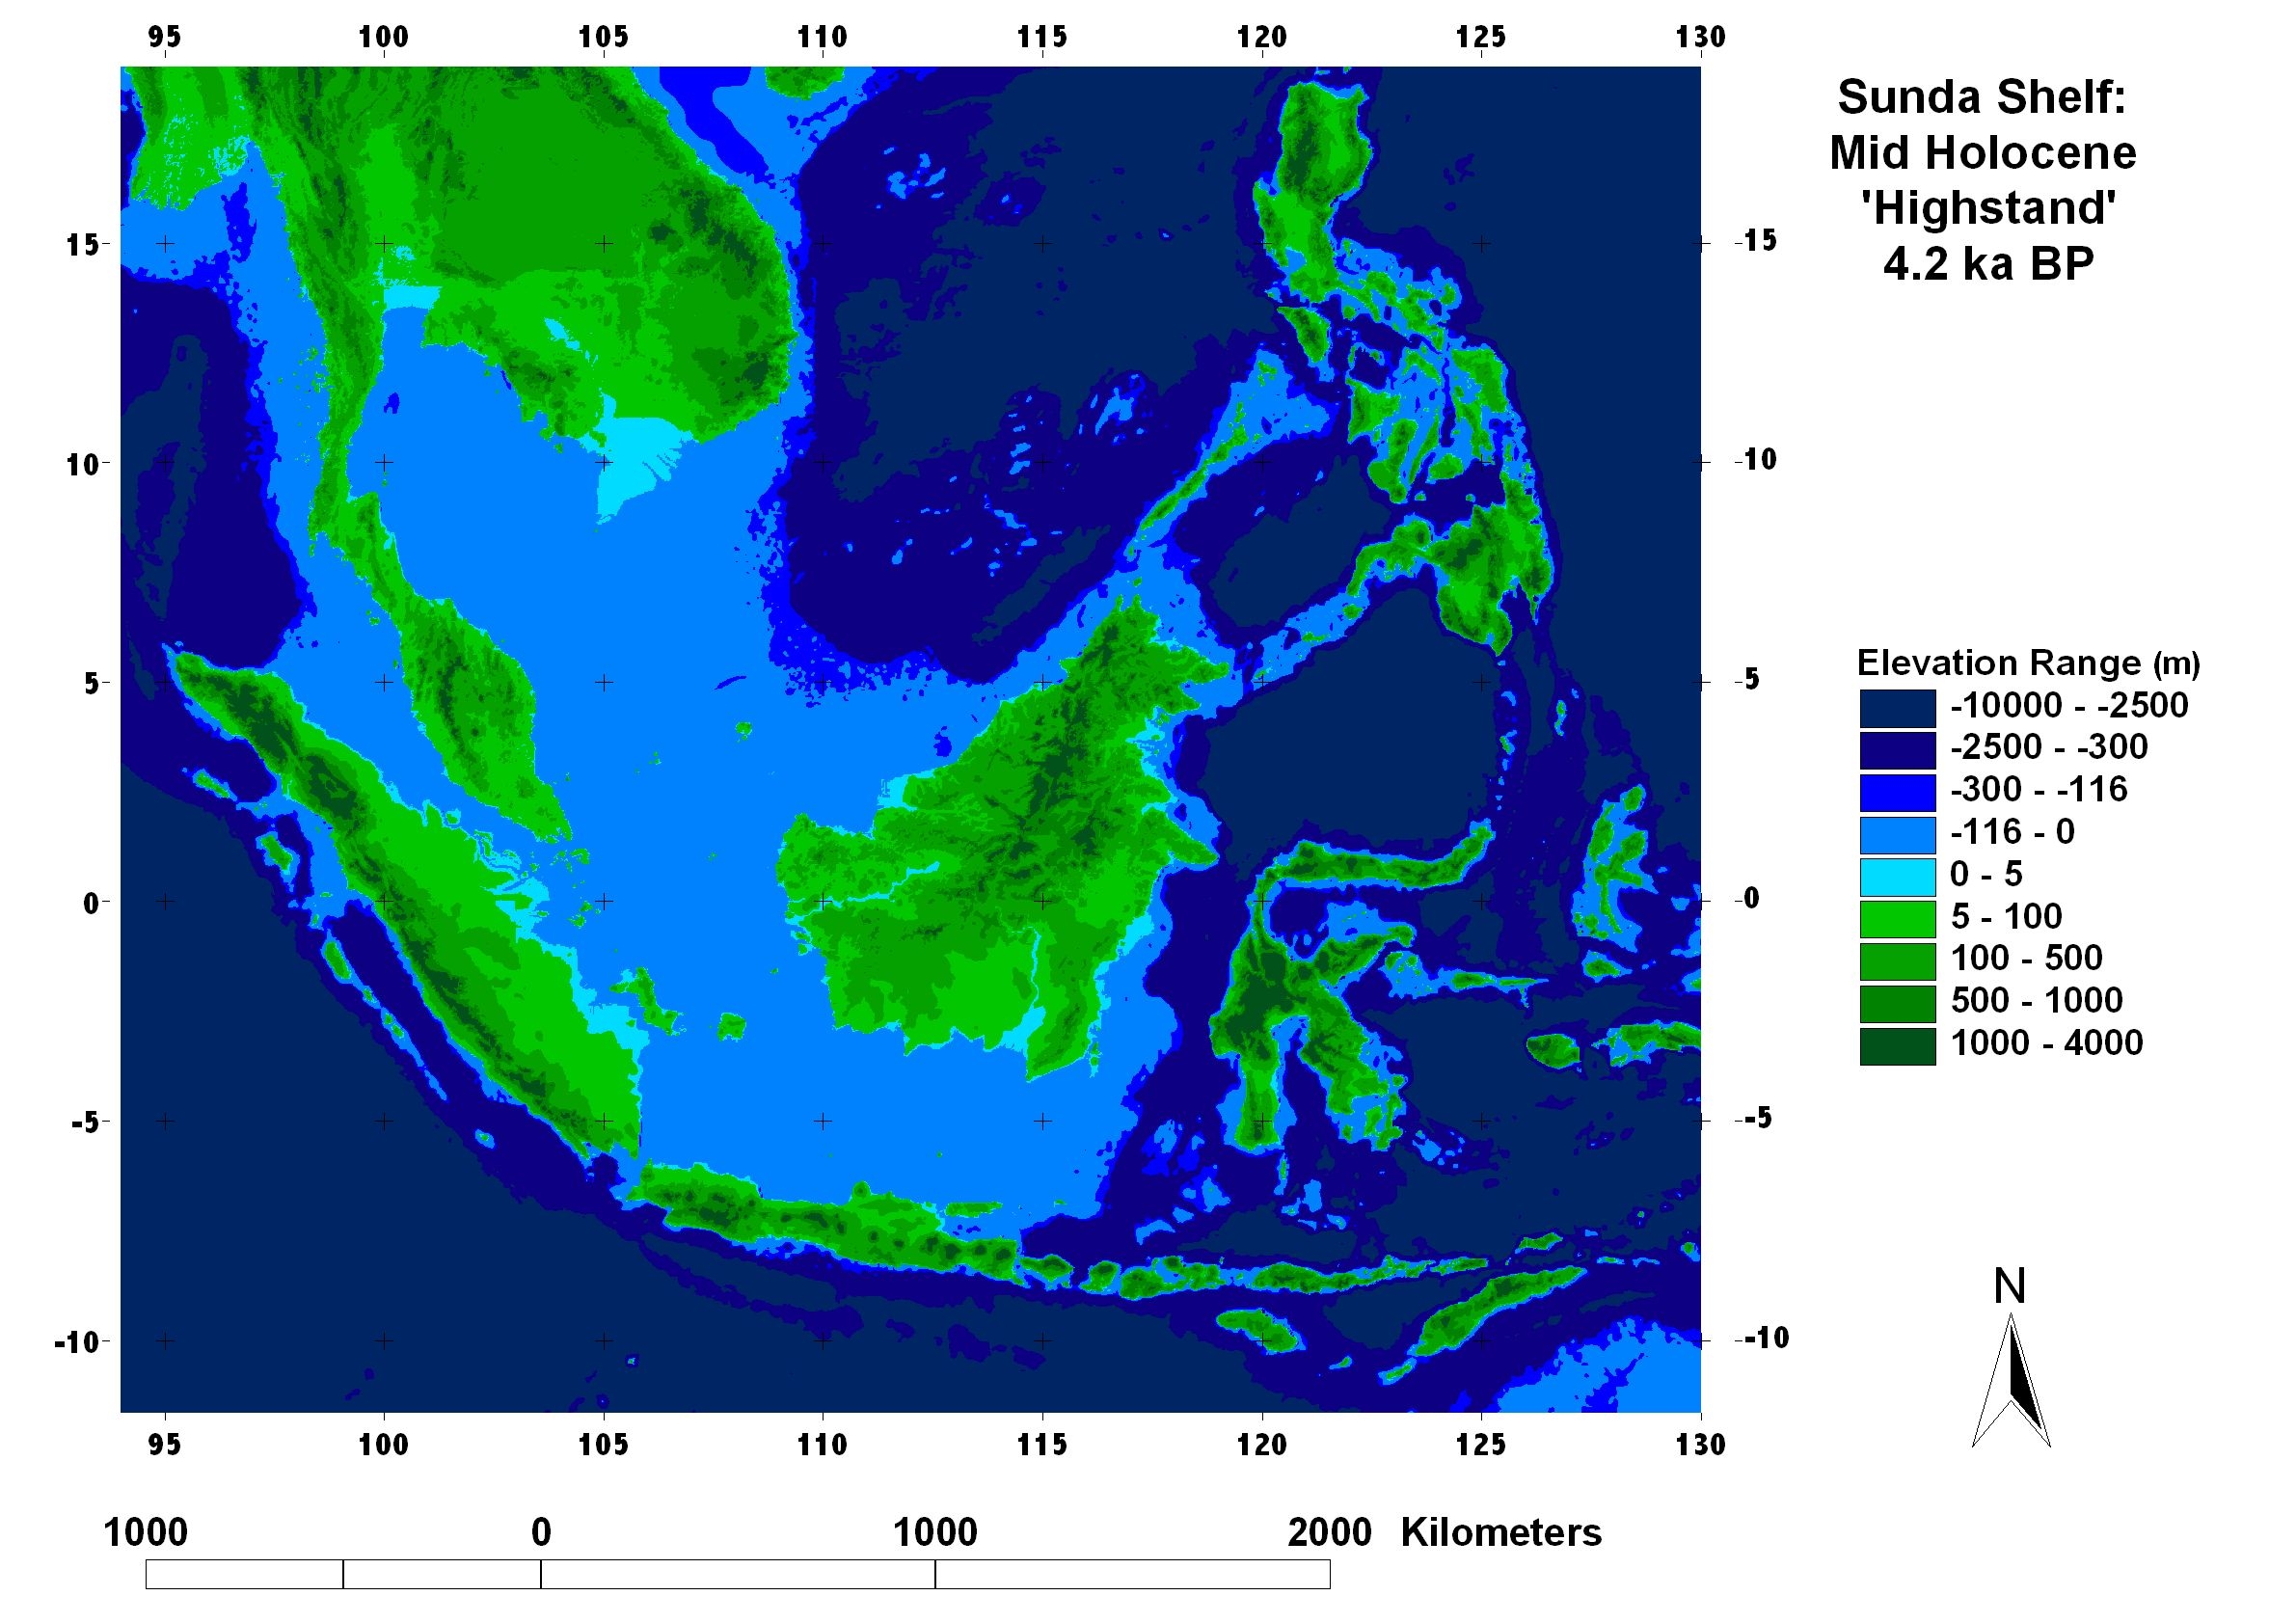
Figure 27 Sunda Shelf: Present day topography
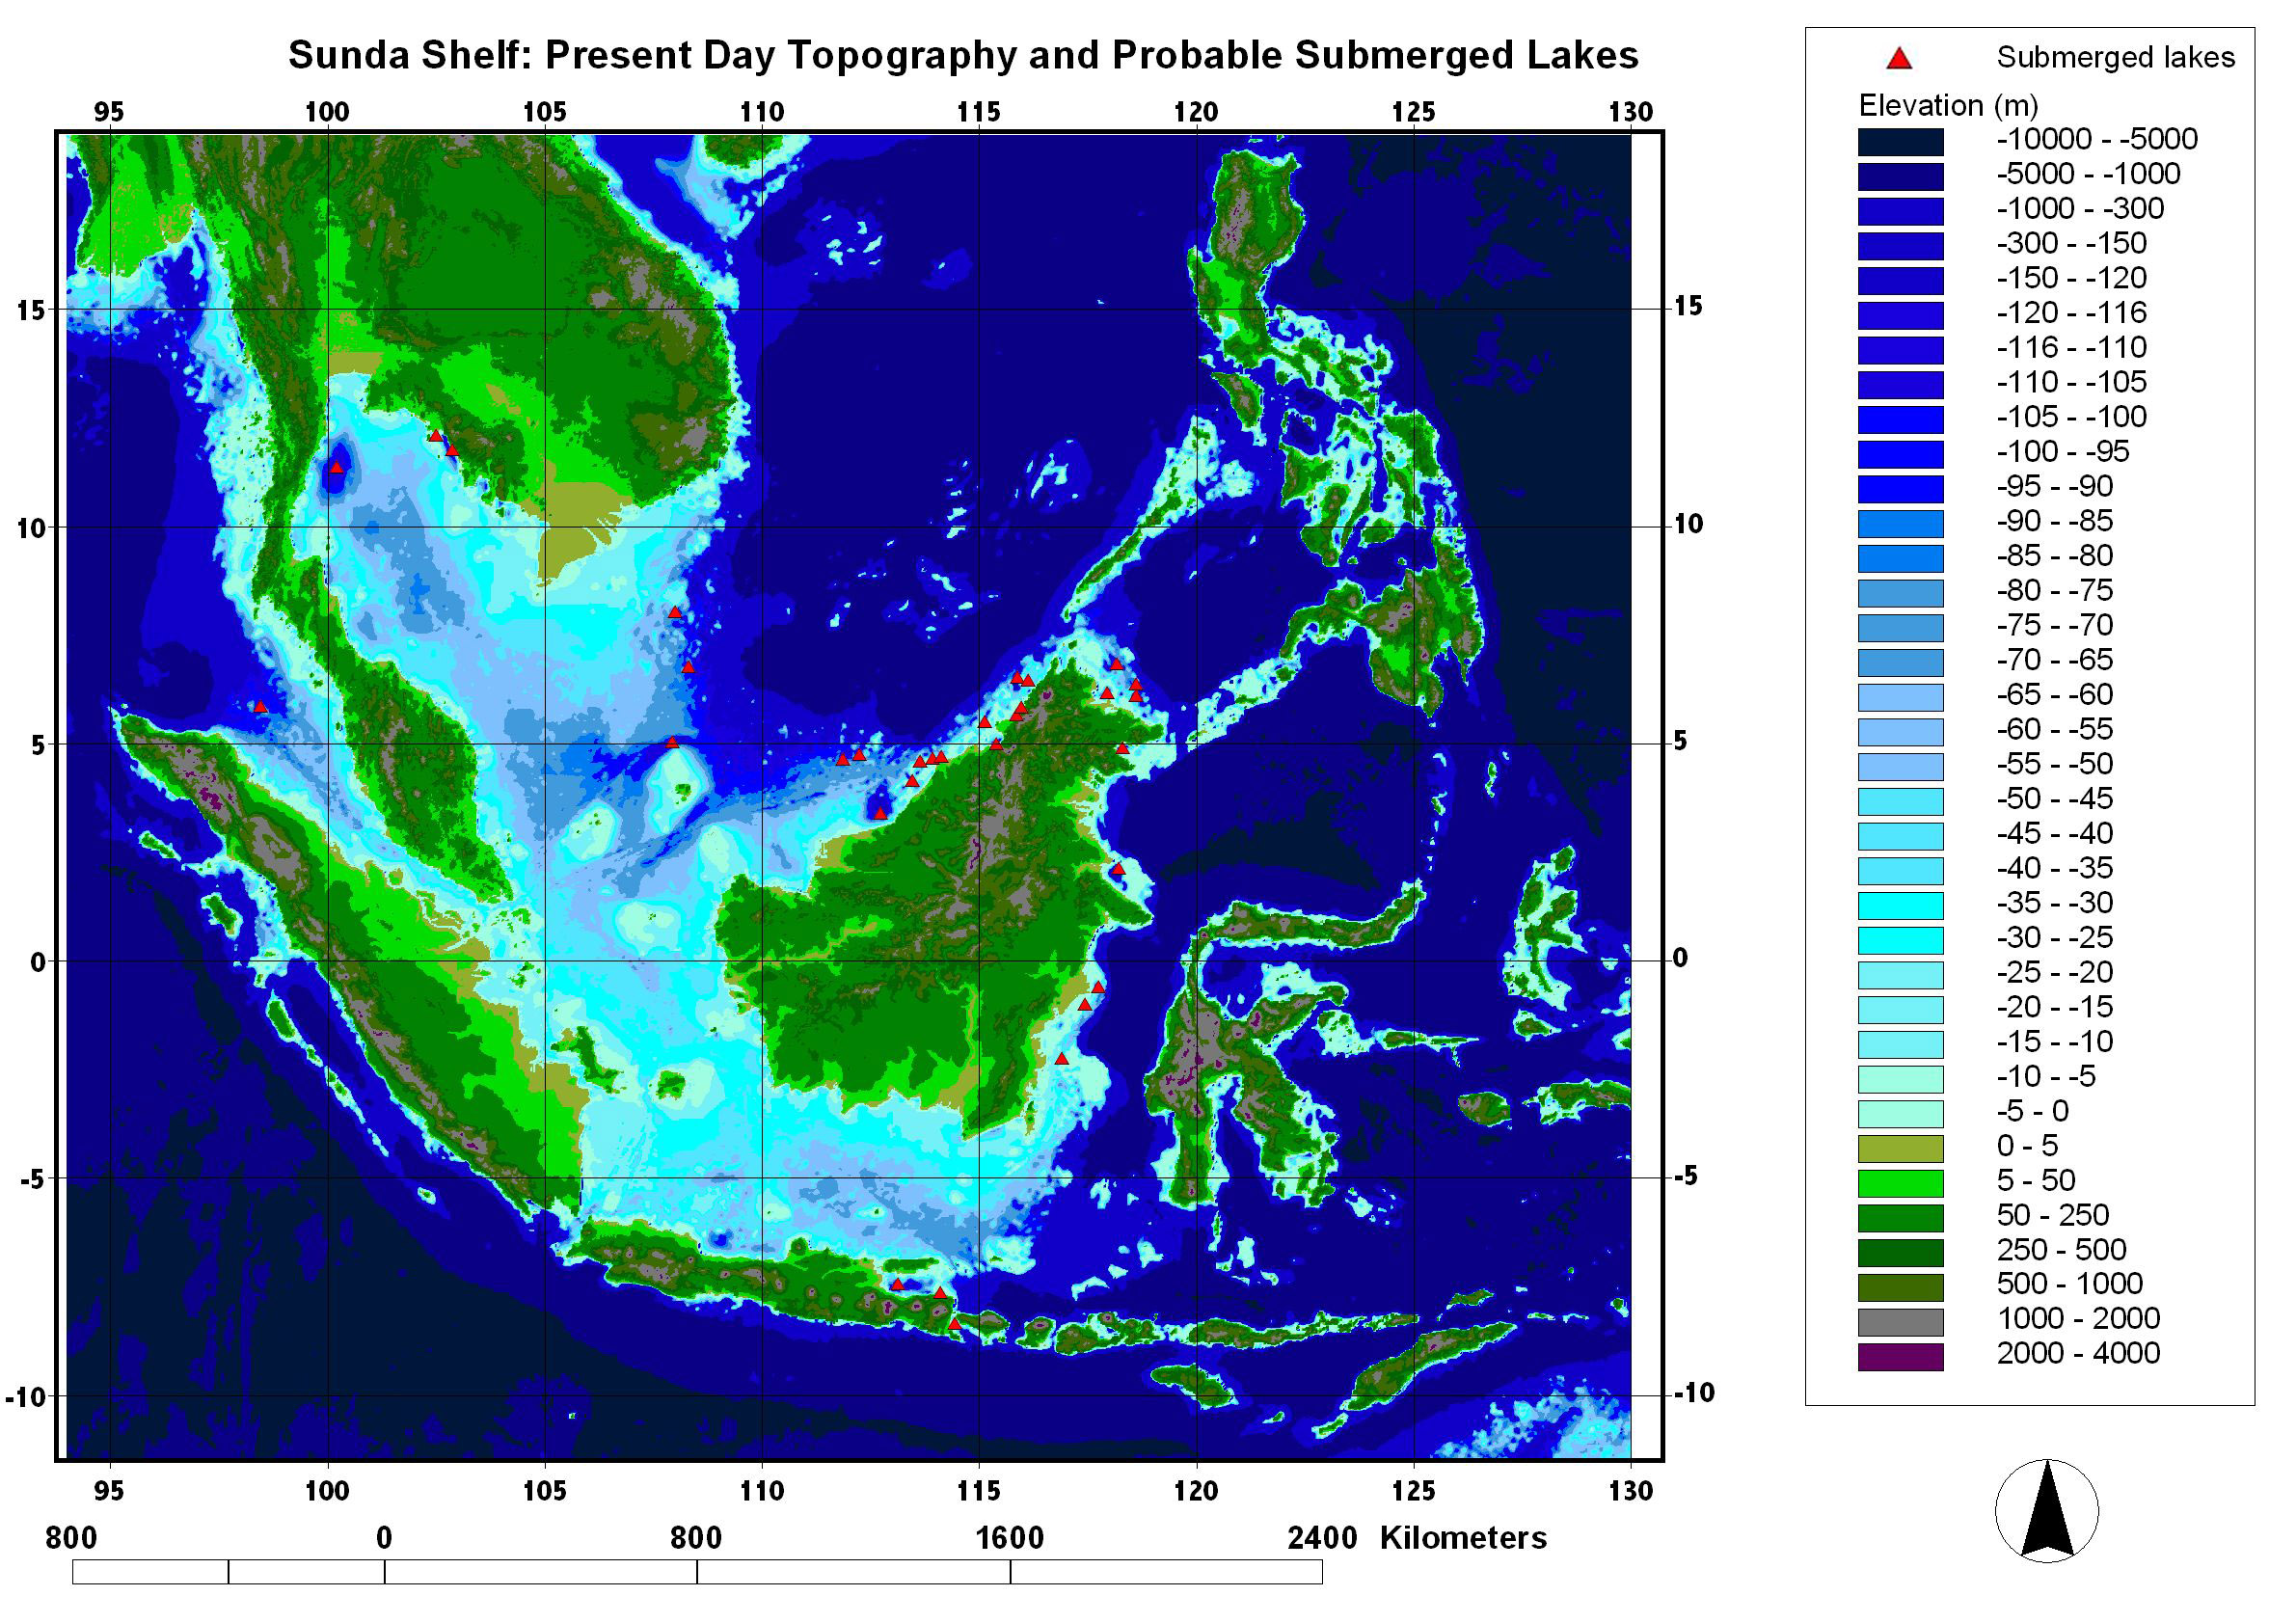